QR Code Analytics: How to Track and Improve Every Scan
Last updated:
ShortPen University


LucaG is the co-founder of ShortPen. Before that, he built Guadagnissimo from scratch, a personal finance blog that reached hundreds of thousands of readers per year and was later acquired. That experience is where he learned SEO and marketing attribution hands-on. He also runs NTSOT, a newsletter on tools for work and life. His background spans product design, growth, and building online businesses.
Show more
QR codes have surged in marketing, from print ads and packaging to event badges and restaurant menus. But without analytics, they’re just pretty squares.
QR code analytics ties every scan to data: who scanned it, when and where, and (crucially) what they did next.
By tracking QR performance and analyzing campaign performance, you turn guesswork into insight, seeing which campaigns really work and which don’t.
Modern link-tracking platforms (like ShortPen) make this easy by automatically recording each scan as a click, so you can focus on improving campaigns rather than wondering whether they succeeded.
What QR Code Analytics are and why They Matter
QR code analytics means collecting data each time someone scans your code. This includes counts (how many qr code scans and how many unique scanners), context (device type, scan locations, referrer), and outcomes (did they sign up, buy something, etc.?).
In other words, it answers which campaigns drive real results, providing actionable insights for future effor .
For example, Rebrandly notes that without tracking, “most marketers create codes for print or packaging, then have no idea if they’re driving results”.
With tracking, you see “when, where, and how many people scan your codes,” so you can optimize what’s working.
Similarly, ShortPen highlights that “the most critical insight isn’t just that someone scanned your code, but whether that scan led to a valuable action. This is the difference between measuring attention and measuring results”.
In short, QR analytics shows you who engages with your offline media and whether it translates into clicks, sign-ups, purchases, or other conversions.
This visibility lets marketers shift budget away from underperforming channels and double down on the high-impact ones.
Setting up QR Code Tracking
To measure scans, start by creating trackable (dynamic) QR codes:
Use a link management platform with built-in analytics. Don’t rely on a basic QR generator that only creates a code image. Pick software (like ShortPen) that ties each QR to a short, trackable URL. These links should be branded (custom domain) and have UTM parameters or tags so you know which campaign or placement each scan came from. Branded URLs (e.g., go.yourbrand.com/summer-sale) build trust and can boost engagement.
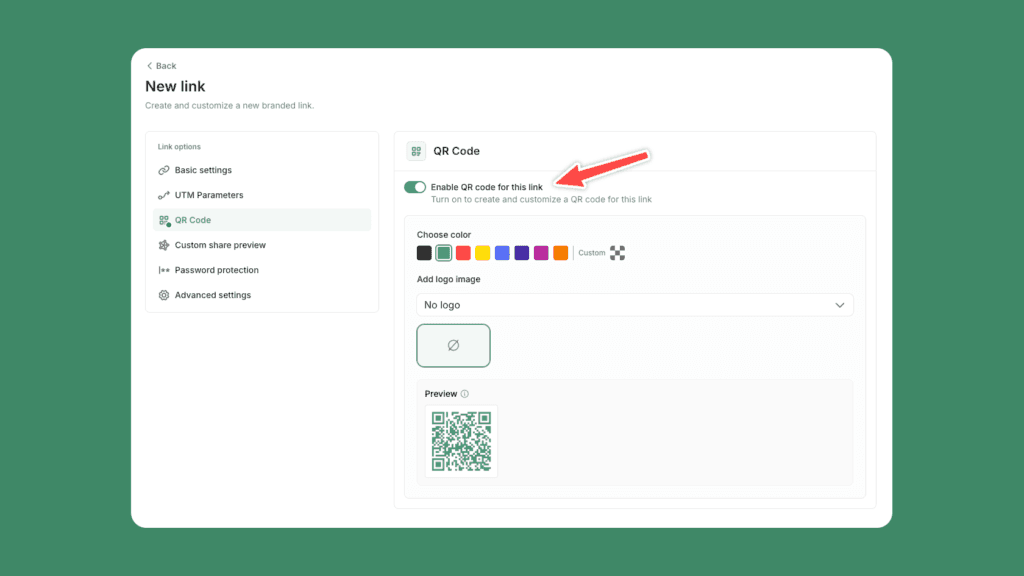
Enable QR codes in your link. In ShortPen, for example, you create a link (set its destination, slug, and UTM tags) and then toggle “Enable QR code” in the link editor. You can customize the code’s appearance (colors and logo) before saving. Once saved, you’ll have a dynamic QR code image to download (SVG for print, PNG/JPG for quick digital use).
Test before launch. Always scan your QR codes with different devices and in various lighting conditions. Make sure they work indoors and outdoors, in small and large sizes. (As Rebrandly advises, “Scan your codes with different phones and in different lighting conditions” to ensure reliability.)
Install tracking pixels/events (optional but powerful). For post-scan analytics, add a tracking pixel to your landing pages and define conversion events (e.g., form submissions, purchases). ShortPen’s system can automatically tie these events back to the scanned link (see next section).
Following these steps ensures that every scan feeds into your analytics. In practice, the workflow is simple: create a dynamic link (with UTM tags), generate its QR code, deploy it in ads, across print or digital media, and then watch the analytics roll in.
How QR Code Tracking Works
Dynamic vs. Static QR Codes

There are two types: static codes (just a fixed image pointing to a URL) and dynamic codes (powered by a link management platform).
Static QR codes can’t be edited or tracked. Once printed, you have no data on who scanned.
Dynamic QR codes, on the other hand, encode a short URL on a server. When someone scans, that server logs the scan before redirecting the user to your destination.
ShortPen uses dynamic QR codes exclusively so that you can change the link’s destination later, and the same code still works.
Tracking the Scan
When a dynamic QR code is scanned, ShortPen increments the scan count for that link.
In the platform’s analytics, every scan is recorded separately from clicks (online). You’ll see both total scans and unique scans, like click metrics.
Each scan log could include details like device and OS (Android, iOS, etc.) and location (country/city).
After the Scan: Event Tracking
The real power of QR analytics comes from what happens after the scan.
ShortPen can tie scans to conversions: if you’ve added the ShortPen Pixel to your website and defined events (like “Newsletter Signup” or “Purchase”), the system will record which scans led to those events.
In practice, you install a single JavaScript pixel on your site, then use ShortPen to set up events and conversions.
In short, scanning a QR is treated just like clicking a link. You can follow the entire user journey from scan to sign-up or sale.
The Best QR Code Analytics Tool: ShortPen

Not all QR-tracking tools are equal.
ShortPen stands out as a comprehensive link-tracking platform that seamlessly integrates QR code analytics into its link management system.
Unlike basic QR generators or pure shorteners, ShortPen provides dynamic, branded QR codes and robust post-click analytics.
You get everything in one place: branded links, dynamic QR codes, UTM tagging, and conversion analytics.
In practice, using ShortPen for QR codes is straightforward: you create a link (set its URL, custom domain, and slug, and add UTM parameters), toggle on the QR code, then distribute the code. ShortPen automatically tracks each scan under that link.
In the dashboard, you’ll see the number of scans, a breakdown by device and location, and any conversions tied to that link.
Because the QR code is dynamic, you can even update the link’s target page later without reprinting your codes (only changing the slug or domain would require a new download).
By comparison, many free or standalone QR tools lack this depth.
For instance, Canva’s QR codes are static. They can’t be edited later and don’t track scans at all.
Even platforms like Bitly and Rebrandly often require premium plans for advanced QR analytics or event tracking.
That end-to-end visibility makes ShortPen one of the best link-tracking solutions for any QR code campaign, enabling data-driven decision-making.
How to Track QR Codes with ShortPen
Create a link in ShortPen: In the web app, click New Link. Enter your destination URL (the page users should reach) and choose a custom slug and domain for branding. Add UTM parameters or tags (e.g., campaign name, placement) to each link so it is clearly labeled.
Enable the QR code: In the link editor’s sidebar, open the QR Code section and toggle “Enable QR code for this link” on. You’ll see a preview of the code.
Customize and save: Optionally set the QR code’s color and logo to match your brand. Then save (or create) the link. After saving, ShortPen will generate a dynamic QR code image. Download it (via the success dialog or the link details page) as an SVG/PNG for use in your campaign.
Distribute your QR code: Use the code in your offline or online materials, print it on posters, packaging, flyers, badges, direct mail, or include it in an email/header on your website. Each placement should use the appropriate UTM-tagged link to track it separately.
Monitor scans and conversions: In ShortPen, go to Links → [Your Link] → Analytics. Here you’ll see QR Scans (total and unique) alongside clicks. Charts and tables break down scans by time, location, device, language, etc. If you set up the ShortPen Pixel and defined events (in the Events tab), you’ll also see the count and conversion rate (%CR) for each event triggered by that QR.
The Essential Metrics to Monitor
When evaluating a QR campaign, focus on actionable metrics:
Total & Unique Scans: How many times was the code scanned, and by how many distinct people? (A big gap means repeat scanners.) These tell you the reach of your offline promotion.
Device & OS: Are people scanning with iPhones, Androids, tablets, or desktops? If mostly mobile, ensure your landing page is fully mobile-optimized.
Geography: Where are scanners located (country/city)? Pinpoint high-performing regions to target similar venues or cities.
Time & Day: When do scans spike? Look for daily or weekly patterns (e.g., lunchtime, weekends). Use charts to spot peaks or lulls in engagement.
Traffic Source: If you used UTM tags, see which channel or placement drove each scan (e.g., email footer vs. in-store poster). This tells you which marketing channels are most effective.
Post-Scan Conversions: Ultimately, track outcomes like form submissions, sign-ups, purchases, or downloads after the scan. Conversion rate (event completions ÷ scans) is key. For example, three scans resulting in 1 signup is a 33% scan-to-signup rate. Comparing these rates across different codes shows which QR placements drive business value.
Engagement Trends: Use ShortPen’s charts to overlay scans and event conversions over time. A rise in scans followed by a rise in sign-ups indicates a successful campaign.
Real Use Cases Across Online and Offline Channels
QR codes bridge offline and online marketing. Here are a few examples of where detailed QR analytics make a difference:
Retail & Packaging: A clothing store adds a QR code to a new jacket’s tag. ShortPen reports might show “200 scans, 45 add-to-cart clicks,” revealing a clear offline-to-online conversion path. This lets the store know that nearly 23% of scanners showed strong purchase intent online. Without tracking, those insights would be lost.
Events & Conferences: Imagine unique QR codes on session handouts or attendee badges. Organizers can compare scans per session to gauge crowd interest. In one case, a speaker’s feedback form QR was scanned 300 times but only 50 people finished it, signaling the form was too long or confusing. The team shortened the survey, and completion rates shot up in the next session.
Restaurants & Menus: A café uses QR codes on paper menus. Basic analytics might show “500 scans this week,” but by analyzing which menu sections get the most attention, managers might find the “Gourmet Burgers” digital section was viewed far more than “Healthy Salads”. This insight can drive menu redesign or highlight new high-margin items.
Real Estate & Field Marketing: An agent places a QR code on a “For Sale” sign. Analytics reveal that most scans occur on weekends between 2–4 PM. Armed with this, the agency schedules open houses during those peak times to maximize interest.
Print Media & OOH Advertising: Any billboard, flyer, or direct mail piece can carry a QR code. By tagging each placement (e.g. “subway ad Oct2025”, “newsletter Nov2025”), ShortPen lets you compare performance across channels. You might find that QR codes on coffee shop table tents get triple the scans of those in a standard magazine ad, prompting a shift in budget.
In each case, companies moved beyond mere scan counts. They tied QR scans to real actions (carts, sign-ups, leads) to fine-tune strategy.
This kind of granular, cross-channel insight is only possible with a tool like ShortPen. It lets you deploy codes in both online (e.g., email footers, social posts) and offline (print ads, packaging, events) channels and measure the full customer journey.
FAQ
What metrics can I track with QR code analytics?
You can measure scan volume (total vs unique), timing patterns, device/OS breakdown (Android vs iPhone, etc.), geographic location, and referrer/source (using UTM tags). Crucially, you can also track post-scan user actions, for example, how many scanners signed up for your newsletter or made a purchase. Many platforms (including ShortPen) will report both scan counts and conversion counts/rates for each event.
What’s the difference between dynamic and static QR codes?
A service hosts dynamic QR codes, so you can later edit their destination URL and collect analytics on scans. Static codes are fixed and encode a URL in the image; they offer no tracking and can’t be changed once printed.
Conclusion
QR code analytics turns passive scans into actionable insights that can refine your marketing efforts. By using a comprehensive link-tracking solution like ShortPen, you ensure every scan is measured and every campaign is refined.
With ShortPen, you get dynamic, branded QR codes plus in-depth post-scan analytics, including trackable qr data from total and unique scans to granular conversion events.
This lets your team focus on creative campaigns (print ads, packaging, events, etc.) while ShortPen handles the data.
Ready to stop guessing and start knowing?
Try ShortPen’s free plan today and watch your QR code campaigns come to life.
Sign up now and see how easy it is to track, measure, and improve every scan with one of the best link tracking software tools available.
Ready to make every click count?
Simplify your link management, gain valuable insights, and take control of your online presence. Your journey to better links starts here.