30+ Marketing Metrics to Track: The Essential Guide for Modern Marketers
Last updated:
ShortPen University


LucaG is the co-founder of ShortPen. Before that, he built Guadagnissimo from scratch, a personal finance blog that reached hundreds of thousands of readers per year and was later acquired. That experience is where he learned SEO and marketing attribution hands-on. He also runs NTSOT, a newsletter on tools for work and life. His background spans product design, growth, and building online businesses.
Show more
In today’s data-driven world, tracking the right marketing metrics separates winners from also-rans. Companies that leverage customer insights in their marketing campaigns see 85% higher sales growth than their peers.
Each metric is a quantitative clue about how your strategy is performing, whether it’s web traffic, social engagement, or offline promotions, and guides your next move.
In this guide, we break down 21 key marketing metrics (digital and offline) every modern marketer should measure.
We’ll also highlight practical tips (and tools like ShortPen) that make tracking, attribution, QR codes, branded links, and event conversions much simpler.
Why Marketing Metrics Matter
Marketing metrics translate abstract campaigns into concrete results. They tell you what’s working and what’s not, helping optimize budgets and tactics quickly.
For example, measuring conversion rate or customer acquisition cost shows if your ads are truly profitable, while engagement rates and reach indicate whether your content resonates with the audience.
Good metrics also serve as goals (KPIs) that keep teams aligned.
Harvard Business School notes that clear, quantifiable KPIs let you “evaluate progress toward specific marketing objectives”.
In short, metrics turn guesswork into data-driven decisions about your target audience . By monitoring the correct figures, like website visits, social shares, or sales per campaign, you can pinpoint bottlenecks in your funnel and reallocate resources for maximum impact.
Modern analytics tools (from Google Analytics to marketing dashboards) make collecting this data straightforward.
Tools like ShortPen go a step further by unifying campaign data (links, QR codes, UTMs, on-site events) in one place. With all campaigns measured side-by-side, you quickly see which channels drive results, saving time on manual reporting.
The Most Important Digital Marketing Metrics to Track
Digital marketing metrics fall into three main categories: Traffic & Visibility, Engagement, and Conversion across different marketing channels . Each captures different stages of the customer journey.
Traffic & Visibility
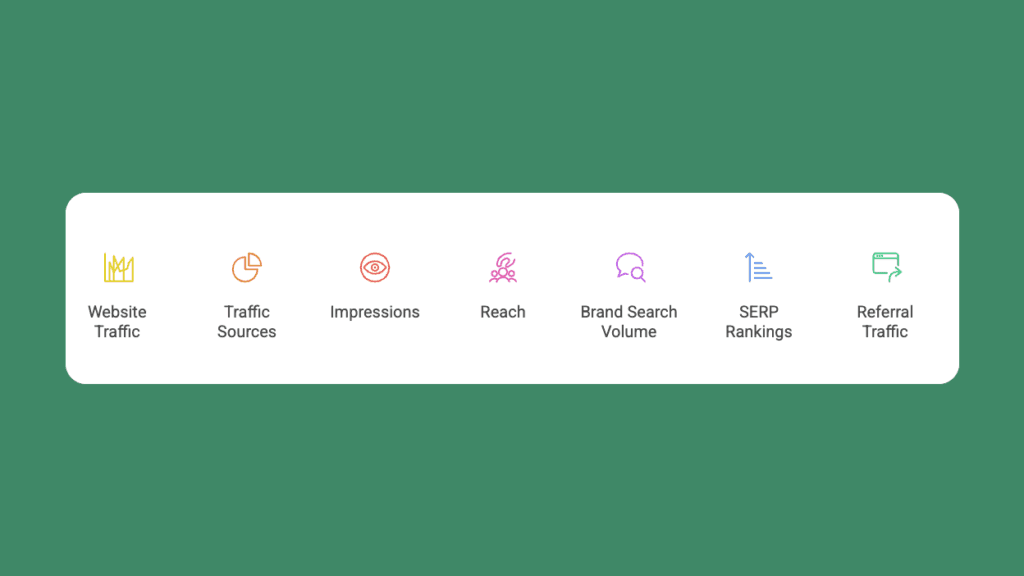
Website Traffic (Sessions/Visits)
The total number of visits to your site (often tracked as “sessions” in Google Analytics).
A growing trend in visits suggests increased reach.
You should also track unique visitors (distinct individuals) to gauge audience size.
Rapid dips or spikes can hint at issues or opportunities (e.g. a campaign launch or technical outage).
Traffic Sources
Break out traffic by channel (organic search, paid search, social, referral, direct). This shows which channels are driving visits.
For example, measure organic search traffic to see SEO impact, or paid social traffic to gauge ad reach.
ShortPen and similar platforms can tag links with UTMs so you know exactly which ad or social post drove each click.
Impressions (Ads/Search)
Count of how many times your ads or content are shown. Google Ads or social platforms report ad impressions, and SEO tools report how often your pages appear in search results.
Impressions measure visibility: more impressions mean more potential exposure, but you need to pair them with CTR and conversion to judge effectiveness.
Reach (Social)
Number of unique users who saw your content (e.g., social media reach or email deliveries). Unlike clicks, reach tells you how big your audience was.
For brand-focused campaigns, tracking reach helps ensure you’re reaching enough people with your message.
Brand Search Volume
Monitor how often people search for your brand or key product terms. Rising branded searches indicate growing awareness.
Tools like Google Trends or Google Ads (Search Queries report) can track volume. While not a “click” metric, branded search is a useful gauge of awareness.
SERP Rankings
Track your keyword positions in search engines. Higher rankings usually mean more clicks and impressions.
Many teams count keyword rank changes as a metric. Improved rankings should eventually reflect in higher organic traffic.
Referral Traffic
Keep an eye on visits from other websites. Referral sources like partner blogs or press mentions are valuable visibility metrics.
A jump in referral traffic might indicate successful PR or content syndication.
Engagement
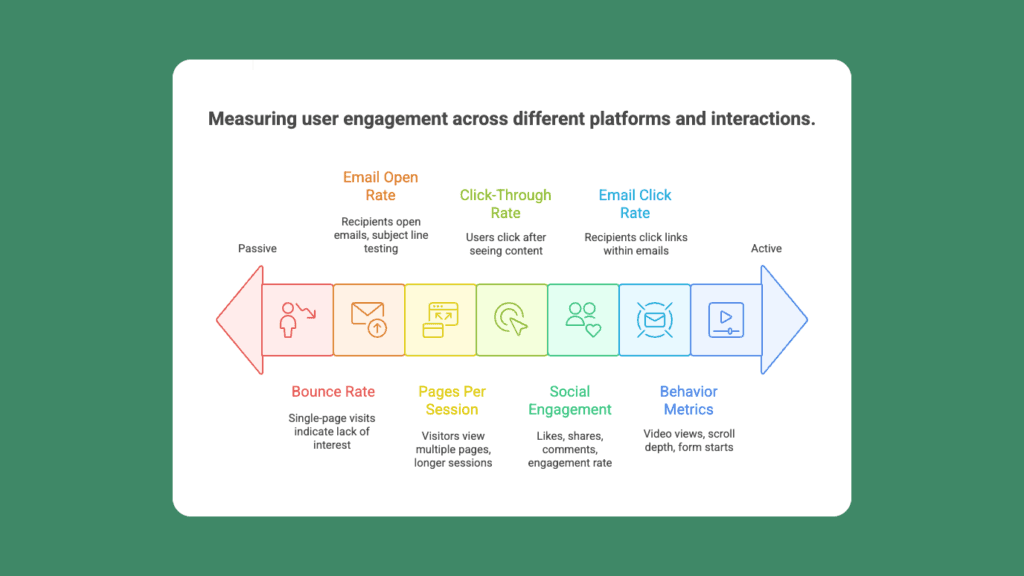
Bounce Rate
The percentage of single-page visits (no interaction).
A high bounce rate (e.g. >70%) often means visitors aren’t finding what they need. Tracking bounce rate (or its inverse, engagement rate) helps assess content quality.
A decreasing bounce rate over time (with rising traffic) indicates stronger visitor interest.
Pages Per Session / Time on Site
How many pages a visitor views and how long they stay. More pages or longer sessions generally indicate deeper engagement.
For example, if new content or website changes increase average session duration, it suggests users like what they see.
Click-Through Rate (CTR)
The percent of people who clicked after seeing something (ad CTR or email CTR).
For example, an email open/CTR report shows how many readers clicked the link.
In advertising, CTR = clicks ÷ impressions. A higher CTR means your message is compelling.
Marketers often compare CTR to industry benchmarks.
Social Engagement
On social media, track likes, shares, comments, and engagement rate (interactions ÷ followers or impressions).
These indicate how compelling or shareable your content is.
While social “likes” alone are often vanity, engagement rate (total interactions per view) is an important signal of content resonance.
Email Open Rate
The percentage of email recipients who open your emails.
Suitable for testing subject lines and send times. Combine with CTR to see how many click through.
However, open rates can be skewed by privacy changes, so use them cautiously.
Email Click Rate
The percent of email recipients who clicked a link in the email. This is a true “engagement” metric for email campaigns and is more actionable than open rate.
Other Behavior Metrics
Depending on the platform, you might measure video views/completion rate, scroll depth, or form starts.
For example, YouTube watch-time or Facebook video completion rate gauge content engagement. These are important on channels where they apply.
Conversion
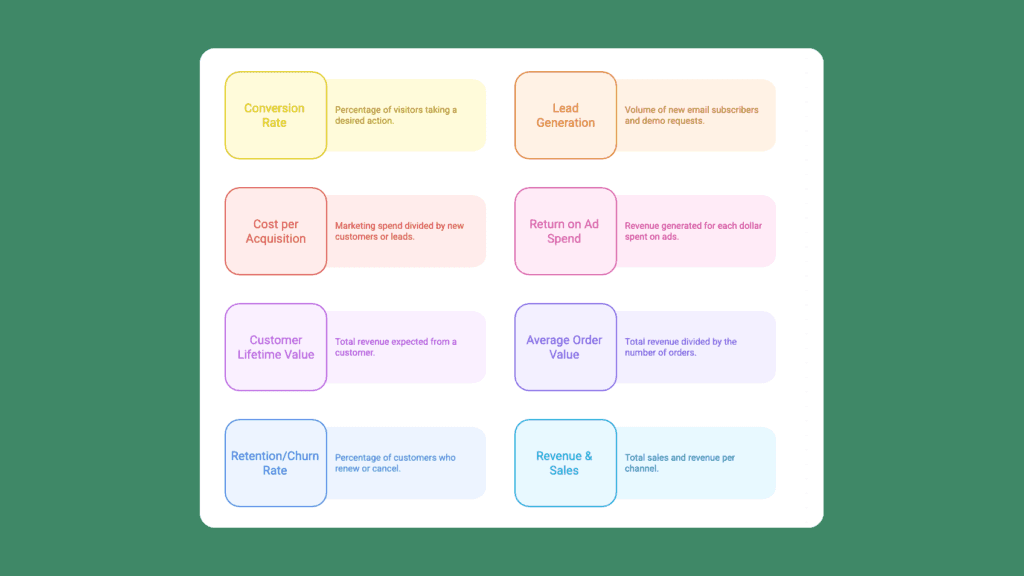
Conversion Rate
The percentage of visitors who take a desired action (e.g., make a purchase, sign up, download a resource).
Conversion rate = (number of conversions ÷ total relevant visitors).
Track overall site conversion rate and break it down by channel or campaign. If a landing page A converts at 5% and landing page B at 2%, you know which is more effective.
Always define what a conversion is (sale, lead, trial signup, etc.).
Lead Generation Metrics
For many B2B and mid-funnel campaigns, count lead volume (new email subscribers, demo requests, demo sign-ups, MQLs/SQLs).
Also track conversion from lead to sale (lead-to-customer rate).
The number and quality of leads tell you if interest is turning into qualified opportunities.
Cost per Acquisition (CPA) / Cost per Lead (CPL)
Marketing spend ÷ new customers (or leads).
This shows efficiency: how much you pay to acquire a customer or lead.
If CPA rises, check for ad inefficiency or increased competition.
ShortPen and analytics platforms can help attribute each acquisition to the right campaign for accurate CPA calculation.
Return on Ad Spend (ROAS) / ROI
How much revenue you get for each dollar spent.
ROAS = (revenue from ads ÷ ad spend). ROI = (profit ÷ spend). These tell if your campaigns are profitable.
For example, a 5× ROAS means $5 earned for every $1 spent on ads.
Tying ad spend to actual sales often requires good tracking (UTMs, conversion tracking).
Customer Lifetime Value (CLV or LTV)
The total revenue or profit expected from a customer over their entire relationship.
Though not immediately measurable by Google Analytics, LTV is crucial for growth planning: if LTV > CAC, you’re on a sustainable path.
Marketers should track LTV, especially for subscription or repeat-purchase businesses.
Average Order Value (AOV)
Total revenue ÷ number of orders. AOV shows the average sale size. For businesses interested in optimizing sales tracking and understanding customer interactions, platforms like ShortPen offer valuable link management and analytics solutions.
Increasing AOV (through upsells or product bundling) can greatly boost revenue without needing more traffic.
Retention/Churn Rate
For subscription or membership models, track the percentage of customers who renew (retention) or cancel (churn) each period.
A high retention rate amplifies LTV and ROI.
These metrics are often business KPIs rather than marketing metrics, but marketing should monitor them (e.g., after welcome campaigns, email drips).
Revenue & Sales
Track total sales and revenue per channel or campaign. Ultimately, marketing should tie to top-line numbers.
For example, if you run a Black Friday campaign, tally the total sales attributable to it.
Tools like ShortPen (with pixel tracking) can link clicks directly to on-site purchases.
KPIs per Channel
You might also track channel-specific metrics, such as click-through rates in paid ads, organic search ranking share, or app download rates. Companies that specialize in advanced link management tools can provide valuable insights into enhancing these metrics.
The key is to convert these into actionable insights: compare each to goals or benchmarks.
The specific metrics you track depend on your business model and goals.
By focusing on these metrics and linking them to business outcomes, marketers can “measure and manage performance” for better ROI.
Always pair each metric with context: time period, target, or industry benchmark, so that, say, “a 2.5% conversion rate” is interpreted meaningfully.
Offline Metrics and Bridging Online/Offline
Offline marketing (print ads, events, TV, billboards, direct mail) still accounts for a large share of ad spend, but it’s traditionally hard to measure.
Here are metrics and tactics for offline campaigns:
Coupon/Promo Code Use
Use unique coupon codes in print or TV ads.
If a sale uses code “NYTIMES10” from a specific newspaper, you can directly count those redemptions.
This ties an offline effort to actual conversions.
Phone Call Tracking
Assign unique phone numbers to campaigns.
Call tracking tools (like CallRail) can log incoming calls per campaign.
The number of calls or trackable inquiries is an offline engagement metric.
Event Attendance or Inquiries
For live events or trade shows, track attendance or on-site sign-ups.
For example, count how many people sign up for a demo at a booth.
Store/Foot Traffic
Retailers can use systems (such as in-store counters or Wi-Fi logins) to estimate foot traffic.
Increases during a campaign indicate offline lift, though attributing those visits to marketing often requires surveys or geo-targeted landing pages.
Media Impressions
For TV, radio, or print, use impressions (audience size, readership) reported by media outlets. For example, a TV ad’s “reach” rating.
These give top-of-funnel awareness reach.
Surveys (Ask Customers)
One of the simplest methods is to ask new customers, “How did you hear about us?” either on web forms, at checkout, or via surveys.
If many say “TV ad” or “billboard,” that’s a sign of success for offline.
QR Code Scans
QR codes bridge offline and online.
Place a QR code on printed flyers, posters, packaging, or ads. Each scan brings a person to a trackable landing page.
ShortPen’s dynamic QR codes can tie those scans to follow-through conversions.
For instance, a QR on a poster might be scanned 500 times, and of those visitors, 50 sign up, so you have a conversion rate for that offline medium.
Unlike fixed URLs, dynamic QR codes can have their destination updated in ShortPen’s UI without reprinting.
Branded Short Links in Print
Use short, memorable URLs (like bit.ly or branded short domains) in print materials. These redirect to tracked pages, letting you count clicks from offline.
ShortPen and similar tools turn each short link into a metric by logging every click.
Vinyl Stickers/LOOP Codes
Some print ads ask readers to “visit example.com/TV” or “scan this code” to receive a special offer.
The number of visits to those unique URLs directly measures offline impact.
Offline Media Spend
Track your offline ad investment (budget spent on TV, radio, print) to calculate ROI later once you have data on results (coupons, surveys, etc.).
In short, make every offline channel traceable with a unique CTA or code.
As one marketing blog notes, adding a QR code or coupon code is “a great way to see the impact of your offline programs”.
ShortPen’s QR features and analytics are explicitly built for this: it recommends using dynamic QR codes on printed collateral and then analyzing scan counts and conversions in the dashboard.
Attribution Across Channels
With consumers using many touchpoints (ads, email, organic search, social, etc.), attribution is crucial.
You need to know which channels or campaigns are actually driving conversions.
Two key practices are UTM tagging and choosing an attribution model:
UTM Parameters (Campaign Tagging)
Always append consistent UTM tags (utm_source, utm_medium, utm_campaign, etc.) to marketing links.
This allows analytics tools (GA, ShortPen, etc.) to capture exactly which campaign or channel each visitor came from. For example, a URL might be website.com/page?utm_source=facebook&utm_medium=paid_social&utm_campaign=promo1.
When clicked, the analytics sees this and attributes the visit (and any conversion) to that Facebook campaign.
As Terminus notes, “UTM parameters are tags that can be added to a URL… allowing Google Analytics to track website visits from campaigns and channels”.
ShortPen makes adding and managing UTMs easy, so every ShortPen link carries the right UTM values for accurate attribution.
Attribution Models (Touchpoint Credit)
Decide how to give credit to multiple touchpoints.
Standard models include first-touch (all credit to first interaction), last-touch (all credit to final interaction), and multi-touch (credit split across multiple interactions).
For example, in first-touch attribution, if a customer first clicked a Facebook ad and later returned via an email campaign, the Facebook ad receives 100% credit.
In contrast, multi-touch models distribute credit: maybe 40% to the first click, 60% to the last, or evenly across all clicks. Multi-touch attribution is more nuanced: “every touchpoint the customer interacts with… is assigned a percent of the credit”.
Larger teams often use multi-touch to get a fuller picture. Whichever model you use, the goal is clear: tie your spend to outcomes.
UTM Consistency
Always use consistent naming conventions (lowercase, no spaces, consistent terms), so reports don’t fragment (e.g., facebook” vs “Facebook” vs “fb” become separate sources).
Consistency lets you compare channels fairly.
Cross-Channel Tagging
Tag not just digital ads but also email (e.g. utm_medium=email) and even offline if possible (for example, include a URL with UTMs on a flyer to capture offline->online source).
By combining UTMs with an attribution model, marketers can see which channels and creative versions drive real results.
Google Analytics offers built-in attribution (last non-direct click by default), and dedicated attribution tools can automate the heavy lifting.
ShortPen’s workspace analytics will show clicks, scans, and conversions by UTMs, tags, or folders, so you can compare performance across campaigns in one place.
Mapping Metrics to the Funnel and Goals
Not all metrics are equally important at every stage. Align each metric to your funnel stage and business objective:
Awareness (Top of Funnel): Metrics like impressions, reach, website traffic volume, new visitors, and branded search volume are key here. These show if people know about you. For example, a TV or social ad should boost impressions and unique visitors. If your goal is brand-building, these “visibility” metrics matter most initially.
Consideration (Mid Funnel): Here, focus on engagement and lead indicators. Website session duration, pages per visit, returning visitor rate, form submissions, and lead sign-ups (newsletter subscriptions, demo requests) matter. These indicate interest. A high bounce rate would be a red flag at this stage.
Conversion (Bottom of Funnel): Focus on conversion rates, number of sales/leads, revenue, and ROI/ROAS. If a campaign is meant to generate sales, the percentage of campaign visitors who convert (or total sales) is the ultimate metric. For example, conversion rate and total sales revenue directly reflect decision-stage success.
As Amazon Advertising explains, a funnel guides stages where a brand’s goal is to attract (awareness), inform (consideration), convert, and engage customers. Metrics should map accordingly.
For instance, in an awareness campaign, we’d track reach and traffic (not immediate sales), whereas in a retargeting campaign, we'd focus on conversions and ROAS.
Always tie metrics to goals using SMART criteria (Specific, Measurable, etc.). For example, if your goal is “increase MQLs by 30% this quarter,” you’d specifically track new MQL count (a conversion metric) and lead conversion rate, rather than vanity likes or open rates.
Tracking Without Dev Help
Marketers shouldn’t need developers to measure these metrics. Modern tools make tracking code-free:
Link Shorteners & QR Codes. Platforms like ShortPen let you create tracked, branded links and dynamic QR codes in the web interface. You don’t need to code. Paste a destination URL, set your domain/slug, and ShortPen generates a short link (and QR code if enabled). Every click or scan on that link is logged in ShortPen’s analytics.
UTMs & Tags via UI. ShortPen and similar tools allow you to append UTM parameters and custom tags to links by filling fields – no coding required. Once set, the system automatically collects and reports on those values.
Event Tracking Pixel. To capture post-click conversions (form submits, purchases), ShortPen provides a lightweight tracking pixel. You can install this on your site by copying a small script snippet into your site’s header (or use its Shopify app, which auto-injects the pixel). No developer means copy-paste only. Once installed, you define conversion events (like “Purchase” or “Signup”) inside ShortPen. The pixel then reports these back to ShortPen, tying them to the correct link or campaign.
Analytics Dashboard. All collected data, clicks, scans, and conversions, are viewable in ShortPen’s link-level and workspace analytics dashboards. You can segment by tags/folders (campaigns/channels) to drill down or aggregate for high-level trends. This provides both micro (single-link) and macro (workspace-wide) views without custom reports.
In short, tools like ShortPen offer no-code tracking: “everything is available in the web app” so marketers can create links, QR codes, and enable tracking themselves.
You get enterprise-level attribution and analytics power without hiring devs or analysts. (For developers, APIs are available too, but they’re not required for basic tracking.)
By contrast, legacy tools like generic URL shorteners or spreadsheets would force manual tracking.
In ShortPen, links are “rich objects” that carry UTMs, tags, QR codes, and pixel-based event tracking in one place.
This unified approach means you collect all relevant metrics, clicks, scans, and conversions, without stitching together different systems.
Mistakes to Avoid
Tracking metrics is powerful, but there are pitfalls:
Relying on Vanity Metrics. Metrics like total followers or likes may look good, but they don’t indicate real value on their own. As noted earlier, stats without context are just noise. Always tie metrics to business outcomes. For example, “1 million ad impressions” means nothing unless you also see what percent clicked or converted.
No Goals or Context. Tracking metrics without benchmarks or goals is pointless. Avoid statements like, “We got 10,000 visitors.” Instead, say “10,000 visitors (+20% M/M) with a 3% conversion rate.” Context (trend, target) makes data actionable.
UTM Inconsistency. Mixing “utm_medium=email” vs. “utm_medium=Email” or typos in campaign names will fragment your data. Always standardize tags across all links.
Incomplete Tracking. Don’t forget to track key touchpoints. For example, if you use bit.ly links but forget UTMs, you’ll know “a click” happened but not why. Always assign tracking for paid ads, social posts, and email links. And remember offline: include trackable URLs (coupon codes, QR) in every print ad.
Wrong Attribution Model. Blindly giving all credit to the last click can undervalue earlier channels. Conversely, first-click might neglect the final conversion step. Pick an attribution model that fits your purchase cycle, or use multi-touch weighting for accuracy.
Overloading on Metrics. Don’t try to track everything. Focus on metrics that align with your goals. Too many metrics can lead to analysis paralysis. For example, if your campaign goal is sales, keep revenue and conversion rate as primary KPIs and use lower-level metrics (CTR, sessions) only as supporting context.
Stale or Dirty Data. Keep your data clean. Regularly archive outdated campaigns/folders, retire old UTMs, and fix broken links. ShortPen, for instance, can stop old links (making a new QR without redirecting the old one) and consolidate expired tags. Clean data ensures your reports remain accurate and meaningful.
By avoiding these mistakes, you’ll ensure your marketing metrics to track truly inform strategy rather than obscure it. Always think, “Does this metric move the needle on a goal?” If not, it may be a vanity metric.
FAQ
What’s the most important growth metric?
The most important growth metric depends on your business model. For SaaS companies, Net Revenue Retention (NRR) is key, as it reflects retention and expansion. An NRR over 100% indicates growth from existing customers alone. For other businesses, metrics like LTV/CAC ratio or marketing ROI may be more relevant. Choose a metric that aligns with your growth objectives, and always consider context, as target rates can vary by market.
How do I measure offline campaigns?
Tracking offline requires creativity but is doable. Use trackable coupons or promo codes in print and TV ads, then count redemptions. Add unique URLs or QR codes on brochures and posters so scans and visits feed your analytics. Conduct post-campaign surveys or ask customers how they heard about you on landing pages. Use geo-targeted landing pages to compare regional traffic. Tools like ShortPen let you generate dynamic QR codes and track scans and conversions. Example: a QR on a direct mail postcard might yield 300 scans, 40 sign-ups, and five sales, all tied to that offline source.
How often should I review metrics?
Regular cadence depends on your campaign cycle. For active campaigns, check key metrics weekly (or daily for paid ads) to catch any issues. However, don’t jump to conclusions on a single day’s dip, always look at a trend (30/60-day view). Monthly reviews are good for medium-term strategy: evaluate campaign ROIs, engagement trends, and pipeline impact. Quarterly or annually, align metrics with business results (like revenue, CLV). The important part is consistency: choose which metrics matter most (e.g., sessions, conversion rate, CPA) and monitor them on a set schedule to spot anomalies and optimize.
What’s the difference between KPIs and metrics?
A metric is any measured value (like pageviews, CTR, or revenue). A KPI is a Key Performance Indicator, a metric deemed critical to business success. In other words, all KPIs are metrics, but not all metrics are KPIs. For example, “email clicks” is a metric, while “leads generated” might be a KPI if your goal is lead growth. Identify a few KPIs that directly map to your goals; the rest are supportive data. Always report KPIs with enough context (targets, timeframes) to inform decisions.
Conclusion
Tracking the right marketing metrics is the backbone of effective marketing. By focusing on meaningful metrics, from broad awareness numbers to fine-grained conversion data, marketers can prove impact and steer investments wisely. Key takeaways: move beyond vanity stats and tie every metric to a goal; standardize tracking (UTMs, tags) for clean attribution; and bridge offline and online with unique codes and QR links. Clean, complete data will yield better decisions.
For many marketers, no-code tools like ShortPen are game-changers. ShortPen combines branded links, dynamic QR codes, UTMs, and a built-in pixel to track clicks, scans, and conversions in one place.
It even allows folder/tag organization and workspace analytics for segmented reporting. In short, ShortPen makes it easy to measure and optimize all these metrics without development overhead.
Embrace the metrics that matter, avoid the pitfalls, and use the right tools, and you’ll turn data into growth. Remember: “Marketers who measure and manage performance create more value”.
Keep your data clean, your goals clear, and watch your marketing ROI climb.
Ready to make every click count?
Simplify your link management, gain valuable insights, and take control of your online presence. Your journey to better links starts here.