Automated Client Reporting: How To Build a System That Proves What Actually Worked
Last updated:
Attribution and analytics

LucaG is the co-founder of ShortPen. Before that, he built Guadagnissimo from scratch, a personal finance blog that reached hundreds of thousands of readers per year and was later acquired. That experience is where he learned SEO and marketing attribution hands-on. He also runs NTSOT, a newsletter on tools for work and life. His background spans product design, growth, and building online businesses.
Show more
Automated client reporting pulls data from each platform on a schedule, drops it into a template and delivers it without anyone copying numbers by hand. It saves the hours. It does not fix a report that cannot connect a campaign to a signup, so fix tagging and conversion tracking before you automate.
Every agency hits the same wall around the tenth client. Reporting week arrives, someone opens six platform tabs, exports six spreadsheets, and rebuilds a deck that looked almost identical last month. It takes hours. Thirty days later it happens again.
Automated client reporting fixes the assembly problem. Data gets pulled on a schedule, dropped into a template, and delivered without anyone copying numbers by hand.
That solves the time problem. It leaves the harder one untouched: whether the numbers in the report actually prove your work made a difference. A report that arrives on time and still cannot connect a campaign to a signup has automated the wrong thing.
This guide covers both. How the system works, how to set it up, and how to fix the tracking underneath it so the report says something worth reading. It also covers what to do when your automated numbers disagree with the ad platform, which happens more often than most guides admit.
Share results with clients
Give each client a ShortPen workspace and send a read-only analytics link instead of screenshots.
What automated client reporting actually is
Automated client reporting is a repeatable system that pulls current campaign data, formats it into a client-ready report, and delivers it on a schedule without someone rebuilding it each cycle.
The phrase gets used loosely. A scheduled PDF export is not a reporting system, and a dashboard link is not a deliverable.
The four parts of a working system
A complete setup has four connected pieces:
Collection. Data pulls from each platform automatically, usually through APIs, without manual exports.
Standardization. Metrics, date ranges, and client identifiers mean the same thing across every source.
Assembly. Current data populates a fixed template rather than a document someone rebuilds.
Delivery. The finished report reaches the right person in the format they use.
Most teams have two of these four working. They automate the data pull, then someone still exports it, reformats it, and emails it manually. Rollstack makes the point well: when clients present your numbers in their own leadership meetings, a login to your dashboard is not a deliverable.
What automation does not replace
Automation handles assembly. It does not handle judgment.
Someone still has to explain why paid social dropped 18% in March, whether that matters, and what happens next. Treat that as scope rather than as a warning label. You are automating the part of the job that has no opinion in it.
Why manual reporting breaks as you scale
Manual reporting works fine at three clients. At thirty it becomes the thing that stops you taking on a thirty-first.
The cost in hours
Published estimates for how long a client report takes vary wildly, and it is worth understanding why before you quote any of them.
Figures range from roughly 2.5 to 20 hours. Sources measure different things: a single report, or everything spent on one client's reporting across a month including data gathering, review, and the meeting afterwards. A few appear to be marketing numbers with no methodology attached.
AgencyAnalytics publishes an illustrative model: 50 clients at 2.5 hours per monthly report and $35 per hour comes to $4,375 a month, or $52,500 a year. That is their model rather than survey data, but the arithmetic is easy to redo with your own numbers.
Agencies also commonly report saving 30-70% of reporting time through automation. In practical terms, that can cut report-building from roughly 60 hours to 20 hours, saving dozens of hours each month.
At the far end, AgencyAnalytics reports that Zib Digital saves 750 hours a month across more than 500 clients and 75 platforms. That is a large agency with a large surface area, not a benchmark a ten-client shop should expect to match.
Research from Funnel found only 14% of agency marketers have extensively automated data integration and report generation.
The consistency problem
The cost that rarely gets counted is credibility.
When reports change shape month to month, when a metric appears in March and vanishes in April, clients stop trusting the document. They cannot tell whether performance changed or the reporting did. Consistent structure is what makes a flat month readable as a flat month rather than as something hidden.
Fix your tracking before you automate anything

This is the step almost every guide on this topic skips, and it determines whether the finished report is worth automating at all.
Automation multiplies the data you already have
Bad data does not improve on a schedule. It arrives faster, in a branded template, carrying more authority than it earned. In practice, 42-54% of automated reporting implementations fail due to data quality issues.
Improvado treats tag completeness as something to audit before buying any tool, using rough thresholds of 60%, 85%, and 95% of traffic correctly tagged. Below the bottom of that range, channel attribution in your report is closer to guesswork than measurement, which is why tagging completeness belongs in a disciplined data analysis process, not just a tooling checklist.
UTM tagging is the foundation of channel reporting
Most channel attribution problems trace back to inconsistent tagging.
One person writes facebook, another writes Facebook, a third writes fb. Your reporting tool treats those as three separate sources. The client sees fragmented numbers, and someone spends an hour reconciling them by hand every month, which is exactly the work automation was supposed to remove.
The fix is unglamorous. Write down one naming convention, lowercase everything, and make sure every person and every tool applies it before you connect a single data source.
The direct traffic problem
Untagged links do not disappear. They collect in a bucket labelled direct or unassigned.
When that bucket is large, the report has a hole in it. You are telling a client that a meaningful share of their traffic came from nowhere in particular, while asking them to renew a retainer based on channel performance. Almost nobody writing about automated reporting addresses this.
Every link you control should be tagged before it goes out: emails, SMS, social bios, partner placements, printed materials, and QR codes.
Branded short links as a clean data source
Short links solve the tagging problem at the point of creation rather than after the fact.
With ShortPen, every link you create records clicks and unique clicks along with country, device, operating system, browser, language, referrer, and timestamp. Links live on your own custom domain, so the tracking layer sits on a domain you or your client owns rather than a shared shortener.
The built-in UTM builder applies tags when the link is made, which removes the hand-typing step where conventions usually break. At workspace level you can then segment analytics by UTM source, medium, campaign, content, and term, plus folders and tags.
The result is a first-party record of every campaign link, independent of what each platform reports. When two sources disagree, you have a third that you control.
ShortPen’s free plan includes unlimited links, unlimited QR codes, unlimited tracked clicks, and one custom domain, which is enough to test whether a tagging convention holds before you spend anything. Analytics history is capped at 30 days on that plan, and dimension breakdowns show the top two rows only, so monthly reporting across a full client roster needs a paid tier.
Reporting on what happens after the click
Clicks are not outcomes
A report full of impressions, clicks, and click-through rate answers whether people saw the campaign. It says nothing about whether the campaign worked.
This gap is the most common reason a client starts questioning a retainer. They are looking at activity metrics and trying to work out which key performance indicators actually reflect business outcomes, not just activity.
If your report cannot connect a campaign to a signup or a sale, the client does that maths themselves, usually badly, so reports should focus on key metrics tied to ROI.
Tracking post-click conversions
Closing the gap means tracking what happens on the site after someone arrives, including post-click performance data rather than just on-site actions.
With ShortPen, you install the ShortPen Pixel once on the site, then define events from the dashboard.
There are two types:
URL-triggered events fire when a visitor reaches a specific page, such as /thank-you or an order confirmation.
Code-triggered events fire from a JavaScript call at the moment something happens, like a form submission or a button click. You then enable event tracking on the specific links you want conversions attributed to.

When someone clicks a link or scans a QR code, lands on the site, and completes the action, that conversion is attributed back to the originating link. This makes it easier to present data that connects campaign performance to outcomes.
The data appears in both link-level and workspace-level analytics, so you can compare campaigns and channels against outcomes rather than against traffic.
For ecommerce clients, the Shopify integration installs the Pixel and maps common events like add to cart, checkout, and purchase without writing event definitions by hand.
One honest limitation: the Pixel runs on sites you control. It will not track actions on a third-party checkout page hosted somewhere else.
Offline and QR campaigns belong in the same report
Print, packaging, events, and direct mail usually vanish from client reports entirely, even though that offline activity should sit beside other marketing channels in the same report. The client spends money on them and receives a report covering only the digital half of their marketing.
Any ShortPen link can also be a dynamic QR code, and scans are tracked separately from clicks.

Because the QR encodes the short link rather than the destination, you can change where it points without reprinting anything. A conference banner, a packaging insert, and a paid social campaign all land in the same analytics view, tagged and comparable.
For clients running offline activity, this is often the most persuasive section of the report because combining offline and digital views gives them a clearer picture of overall marketing efforts.
A note on privacy and first-party data
A lot of content on this topic still runs the argument that third-party cookies are about to disappear and you need to prepare. That framing is out of date.
Google reversed its plan to deprecate third-party cookies in Chrome and shut down the Privacy Sandbox in October 2025, retiring most of its technologies and citing low adoption. Third-party cookies remain in Chrome.
The accurate version still supports the same conclusion.
Safari, Firefox, and Brave block third-party cookies by default, so a meaningful share of traffic is already cookieless regardless of what Chrome does. Consent obligations under ePrivacy and CCPA did not change either.
First-party data you collect directly, including click and event data from your own links, is simply more durable than signals that depend on cross-site identifiers. ShortPen's analytics are cookieless and EU-hosted, and store no personally identifiable information.
How to set up automated client reporting, step by step
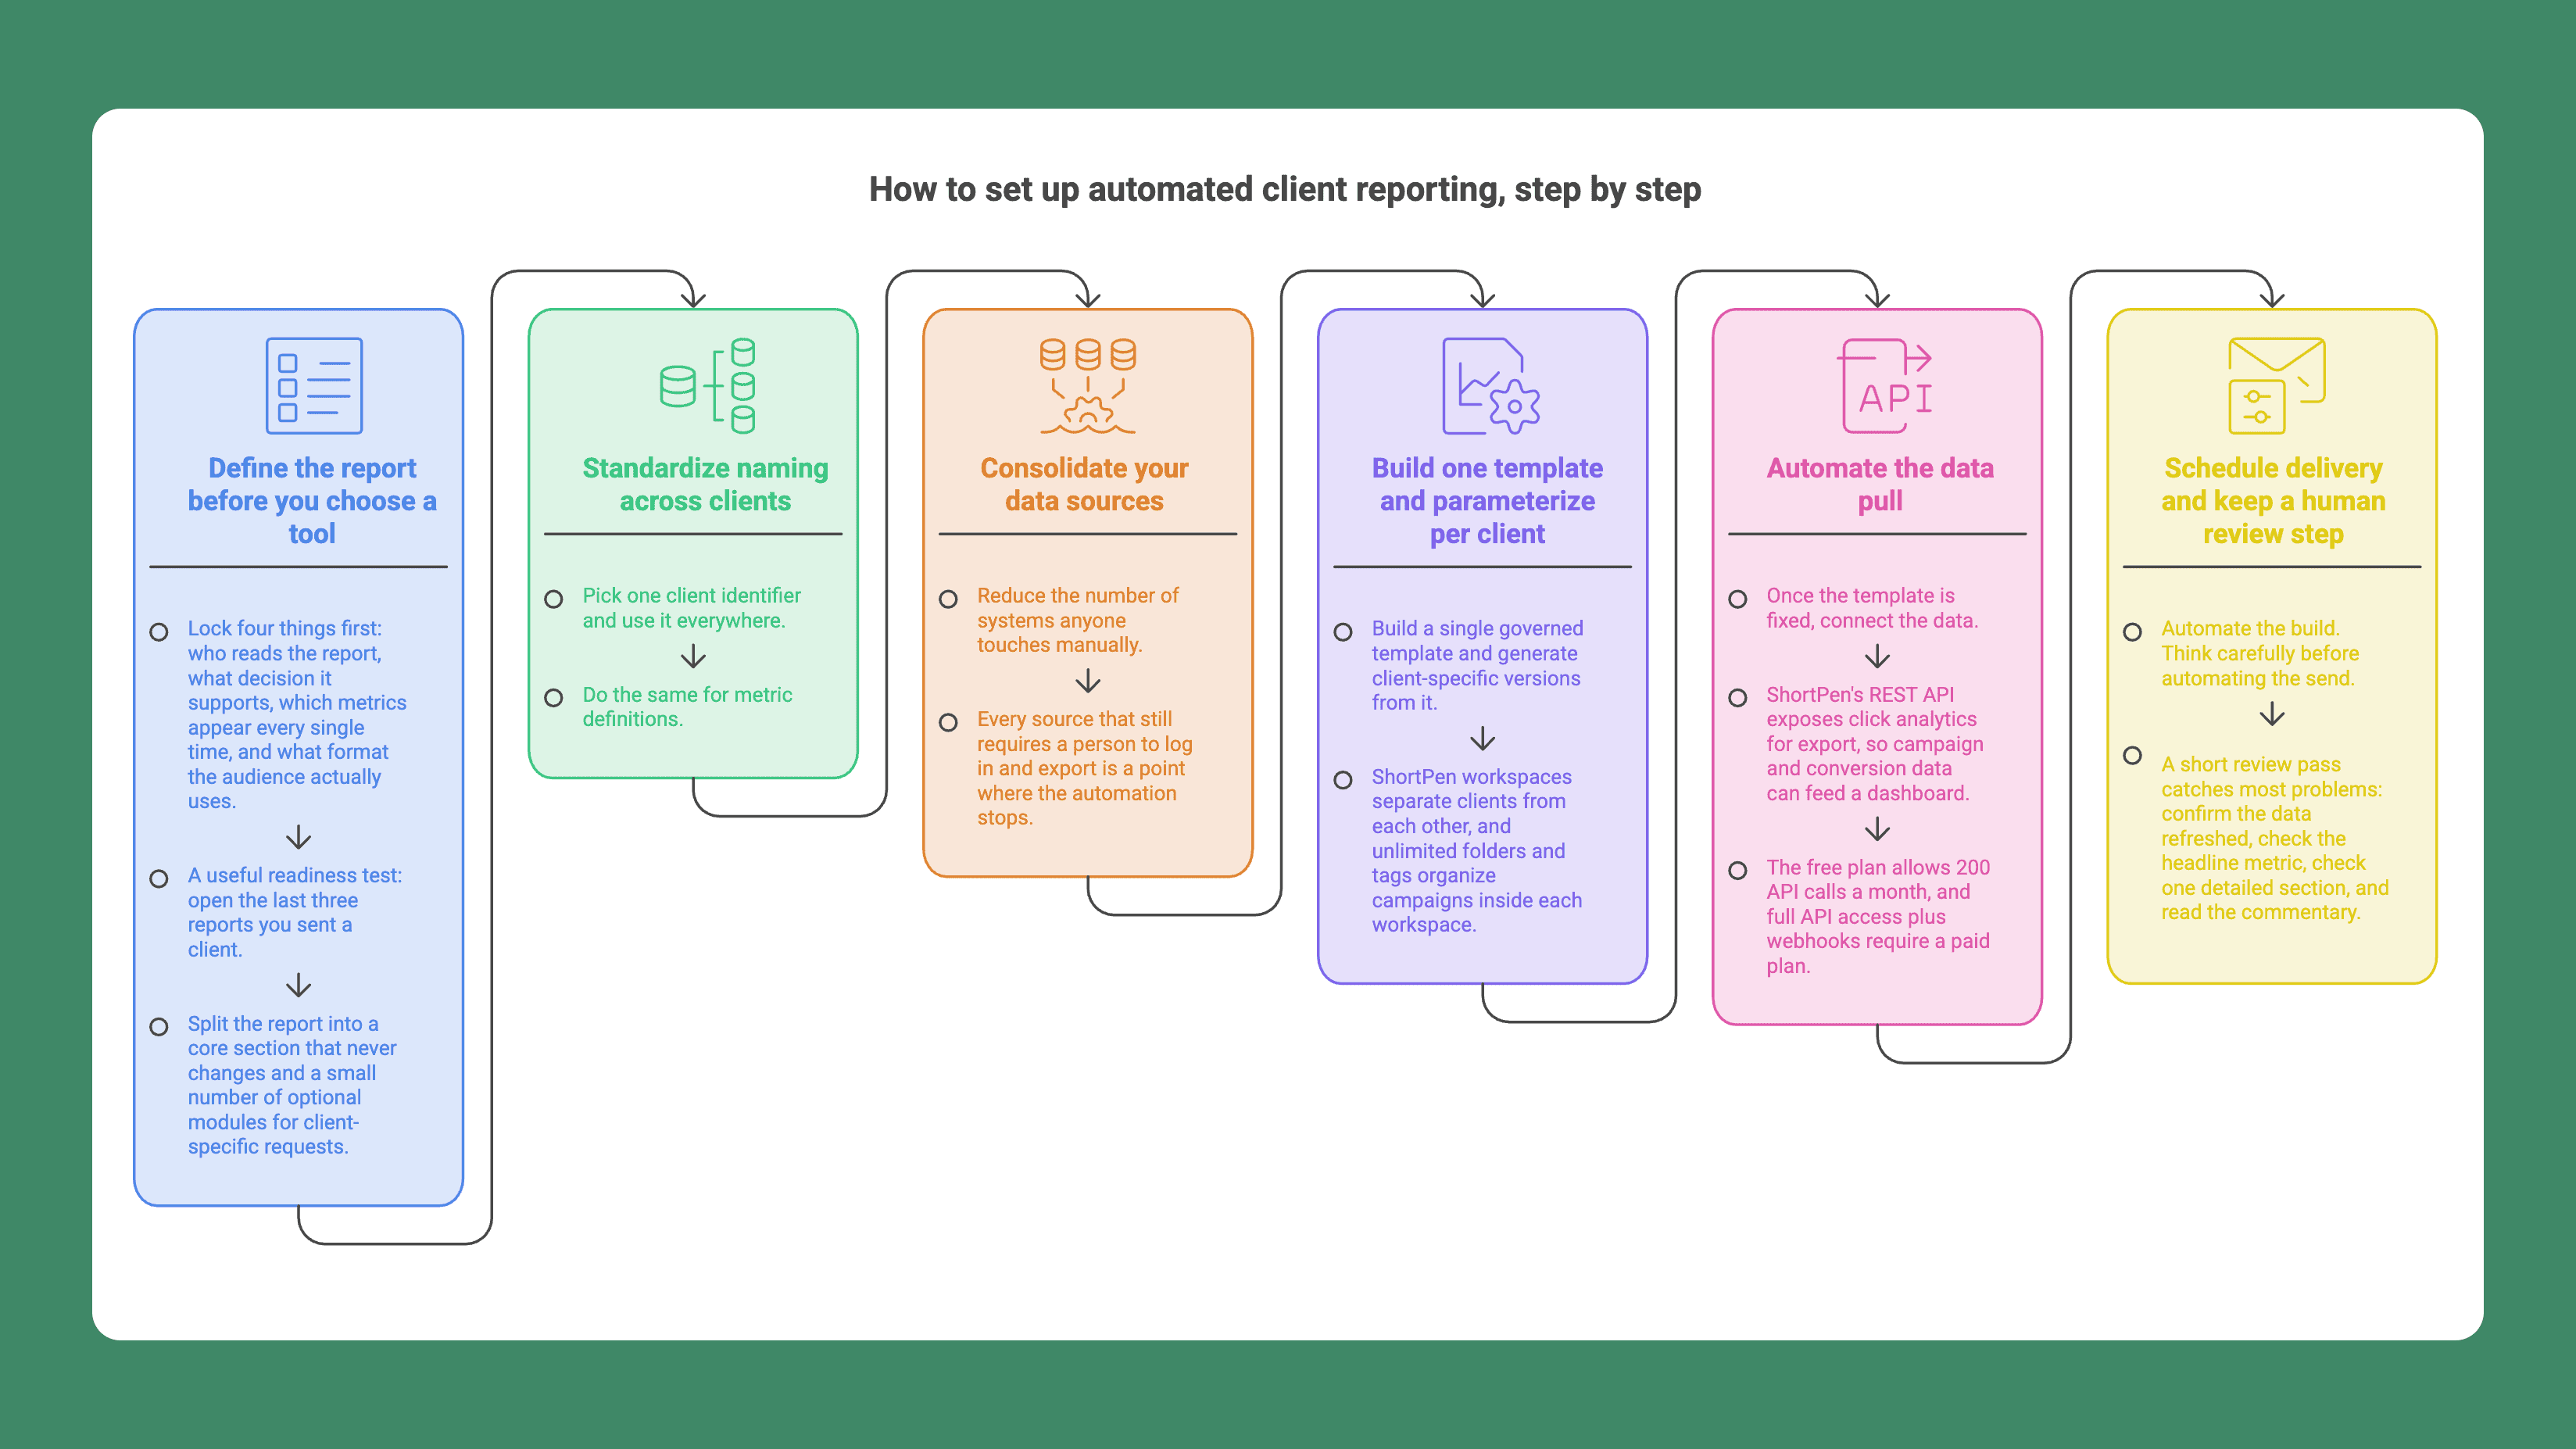
Step 1: Define the report before you choose a tool
Lock four things first: who reads the report, what decision it supports, which metrics appear every single time, and what format the audience actually uses.
A useful readiness test: open the last three reports you sent a client. If the audience, metrics, and format changed each time, you are not ready to automate. You will scale the inconsistency.
Split the report into a core section that never changes and a small number of optional modules for client-specific requests.
Step 2: Standardize naming across clients
Pick one client identifier and use it everywhere. If your CRM uses company name, your reporting tool uses an account ID, and your link tags use an abbreviation, per-client automation will keep breaking.
Do the same for metric definitions. Agree what counts as a conversion, a lead, and a session before anything is scheduled.
Step 3: Consolidate your data sources
Reduce the number of systems anyone touches manually. Every source that still requires a person to log in and export is a point where the automation stops.
If your current process depends on someone downloading three files and pasting them into a sheet, you have a faster manual routine rather than an automated one.
Step 4: Build one template and parameterize per client
Build a single governed template and generate client-specific versions from it. Maintaining forty copies of the same deck is the failure mode this whole exercise exists to prevent.
On the link data side, ShortPen workspaces separate clients from each other, and unlimited folders and tags organize campaigns inside each workspace. Client link data stays segmented by structure rather than by someone remembering to apply the right filter.
The Scale plan is built around this pattern, with 10 workspaces and 10 custom domains for teams running multiple brands.
Step 5: Automate the data pull
Once the template is fixed, connect the data.
ShortPen’s REST API uses Bearer token authentication with keys created under Settings, then Organization, then API Keys. Alongside link creation and management, it exposes click analytics for export, so campaign and conversion data can feed a dashboard, a spreadsheet model, or a reporting template directly.
Responses come back in a consistent JSON envelope, which keeps parsing simple.
Two constraints worth knowing before you plan around it. The free plan allows 200 API calls a month, and full API access plus webhooks require a paid plan. Webhooks matter here because they let click and conversion events push into your stack as they happen rather than waiting for a scheduled pull.
Step 6: Schedule delivery and keep a human review step
Automate the build. Think carefully before automating the send.
A short review pass catches most problems: confirm the data refreshed, check the headline metric, check one detailed section, and read the commentary. Twenty minutes of review beats an unnoticed broken integration going out to forty clients.
Choosing an approach for your client count
The right setup depends almost entirely on how many clients you serve.
Fewer than ten clients
Automation may not pay for itself yet. Improvado is one of the only sources willing to say this plainly, and it is correct. Below roughly eight clients, the setup and maintenance cost often exceeds the hours saved.
Track links and conversions properly, use a shared analytics view so clients can see live numbers whenever they want, and write the commentary yourself. That covers the campaign layer without building a reporting stack.
Ten to fifty clients
This is where purpose-built reporting platforms earn their cost. AgencyAnalytics, Whatagraph, DashThis, and Databox all handle multi-client templating and scheduled delivery. Looker Studio is the free option, though its non-Google integrations are limited.
Fifty or more, or custom requirements
At this scale you are looking at data pipelines and direct API pulls, using tools like Funnel, Improvado, Supermetrics, or an automation layer such as Make.
Dream Code Labs found in a client engagement that a custom pipeline becomes cheaper than no-code subscriptions around 15 to 20 clients, with a £9,500 build paying back in under five months. That is one engagement rather than an industry benchmark, but the crossover logic holds.
Approach | Best for | Main limitation |
|---|---|---|
Shared live dashboards | Under 10 clients | Client has to log in to see it |
Reporting platforms | 10 to 50 clients | Per-client pricing adds up |
Data pipelines and APIs | 50+ or custom stacks | Setup cost and technical skill |
Deck and document automation | Reports presented internally by clients | Upfront template investment |
Verify current pricing directly with each vendor. It changes often.
Mistakes that make automated reports worse
Automating the send instead of the build
The most expensive failure mode. An integration breaks, a metric returns zero, and forty clients receive it before anyone notices. Keep a human between generation and delivery.
Reporting everything
More widgets is not more value. A report with 40 metrics tells the client you did not decide which ones mattered. Cut to the numbers tied to the goal they are paying for.
Letting templates go stale
Campaigns change. Templates usually do not. Review them quarterly and remove sections nobody has referenced in six months, since stale templates also weaken client feedback loops when reports stop reflecting what clients actually ask about. Periodically refine the structure based on that input.
Not reconciling numbers against the source platform
When your automated report disagrees with the ad platform, work through the causes in this order:
Date range. Check whether both systems use the same start and end dates.
Timezone. A report in UTC and a platform in the client's local time will never match exactly.
Attribution window. Platforms differ on how long after a click a conversion still counts.
Conversion definition. Confirm both systems count the same event.
Currency. Check the conversion rate and the date it was applied.
Deduplication. Decide how a user who converts twice is counted.
This sequence is adapted from Improvado, which covers reconciliation more thoroughly than anyone else. Explaining a discrepancy in a client meeting is worth more than numbers that always agree.
FAQ
What is automated client reporting?
Automated client reporting is a system that pulls campaign data from your platforms on a schedule, formats it into a client-ready report, and delivers it without manual assembly. A complete setup covers collection, standardization, assembly, and delivery. It removes the rebuilding work while leaving analysis and commentary to a person.
How much time does automated client reporting actually save?
Published figures range from about 2.5 to 20 hours per client report. Sources measure different things: a single report, a full month of one client's reporting, or an entire team's workload. Rather than trusting any single number, time your own process for two clients over one cycle and use that as your baseline.
Should I automate reporting if I only have a few clients?
Usually not. Below roughly eight clients, setup and maintenance often cost more than the hours saved. Get your tracking and naming conventions right first, since those pay off immediately and make automation straightforward whenever you do reach that point.
Can AI write the client report for me?
AI can draft commentary, summarize changes, and flag anomalies worth investigating. It cannot decide what matters to a specific client or take responsibility for a recommendation. Treat AI-generated narrative as a first draft that a person reviews and corrects before anything is sent.
Why don't my automated numbers match the numbers in the ad platform?
Almost always one of six causes: different date ranges, different timezones, different attribution windows, different conversion event definitions, currency conversion, or deduplication rules. Check them in that order. Small discrepancies are normal, and explaining them clearly builds more trust than pretending they do not exist.
How do I send the same report to multiple clients with different data?
Build one template and parameterize it with a client-level filter rather than duplicating it per client. Most reporting platforms support this natively. On the link data side, separate workspaces per client keep each account's analytics cleanly divided without manual filtering.
Do I need a paid tool to get started?
No. You can establish UTM conventions, branded links, and conversion tracking on free tiers, then upgrade when reporting volume or history requirements demand it. ShortPen's free plan includes unlimited links, QR codes, and tracked clicks with one custom domain, though analytics history is limited to 30 days.
Can I include offline and QR code campaigns in an automated client report?
Yes, provided the offline assets use trackable links. Dynamic QR codes that encode a short link record scans separately from clicks, with the same location and device data. Print, packaging, and event campaigns then appear alongside digital channels in the same report.
Conclusion
The reporting system is only ever as good as the data feeding it. Automating assembly saves hours, which matters, but a report that arrives on time and still cannot connect a campaign to a signup has solved the smaller problem. Getting tagging conventions right and tracking what happens after the click is what turns a status update into evidence.
Start with the tracking layer, since it costs nothing to fix and everything downstream depends on it. Audit how much of your client traffic is properly tagged, close the gaps with branded links, and add conversion events for the actions your clients actually care about.
You can set that up on ShortPen's free plan and have a clean first-party record of every campaign link before your next reporting cycle.
Branded links and QR codes you can edit after printing
Conversions tied to the exact link or QR code, from your website or store online
Workspaces, custom domains and full analytics history as your team grows
Ready to make every click count?
Simplify your link management, gain valuable insights, and take control of your online presence. Your journey to better links starts here.