Content Performance Metrics: What to Track and How to Measure Them
Last updated:
ShortPen University


LucaG is the co-founder of ShortPen. Before that, he built Guadagnissimo from scratch, a personal finance blog that reached hundreds of thousands of readers per year and was later acquired. That experience is where he learned SEO and marketing attribution hands-on. He also runs NTSOT, a newsletter on tools for work and life. His background spans product design, growth, and building online businesses.
Show more
You publish content every week. Traffic moves, a few leads come in, and when someone asks which post actually drove them, you guess.
Content performance metrics are how you stop guessing. They tell you what your content does after you hit publish: who reads it, how they behave, and whether any of it turns into signups or sales.
Most guides hand you a list of twenty numbers and leave you to work out which ones matter. This one sorts them by what they tell you, shows how to measure each, and covers the part almost everyone skips: connecting a specific piece of content to an actual conversion.
What are content performance metrics?
Content performance metrics, also called content performance measures and key performance indicators, are measurements of how well a piece of content reaches an audience, holds their attention, and drives a business outcome.
Reach and attention are the visible half. A post can pull 10,000 views and produce nothing. The other half is outcome: did readers subscribe, request a demo, buy, or come back. Strong content shows movement on both.
No single metric captures this. Views tell you about reach. Average engagement time tells you about attention. Conversion rate and revenue tell you about outcome. You read them together, against a goal you set before publishing.
That last part matters. A metric only means something next to a goal. Forty seconds on a page is good for a quick answer and weak for a 3,000-word guide. Set the goal first, then pick the metrics that prove it and connect your reporting to business goals and business objectives.
The core content performance metrics, by category
Here are the metrics worth tracking, grouped so you can scan to the category that fits your goal.
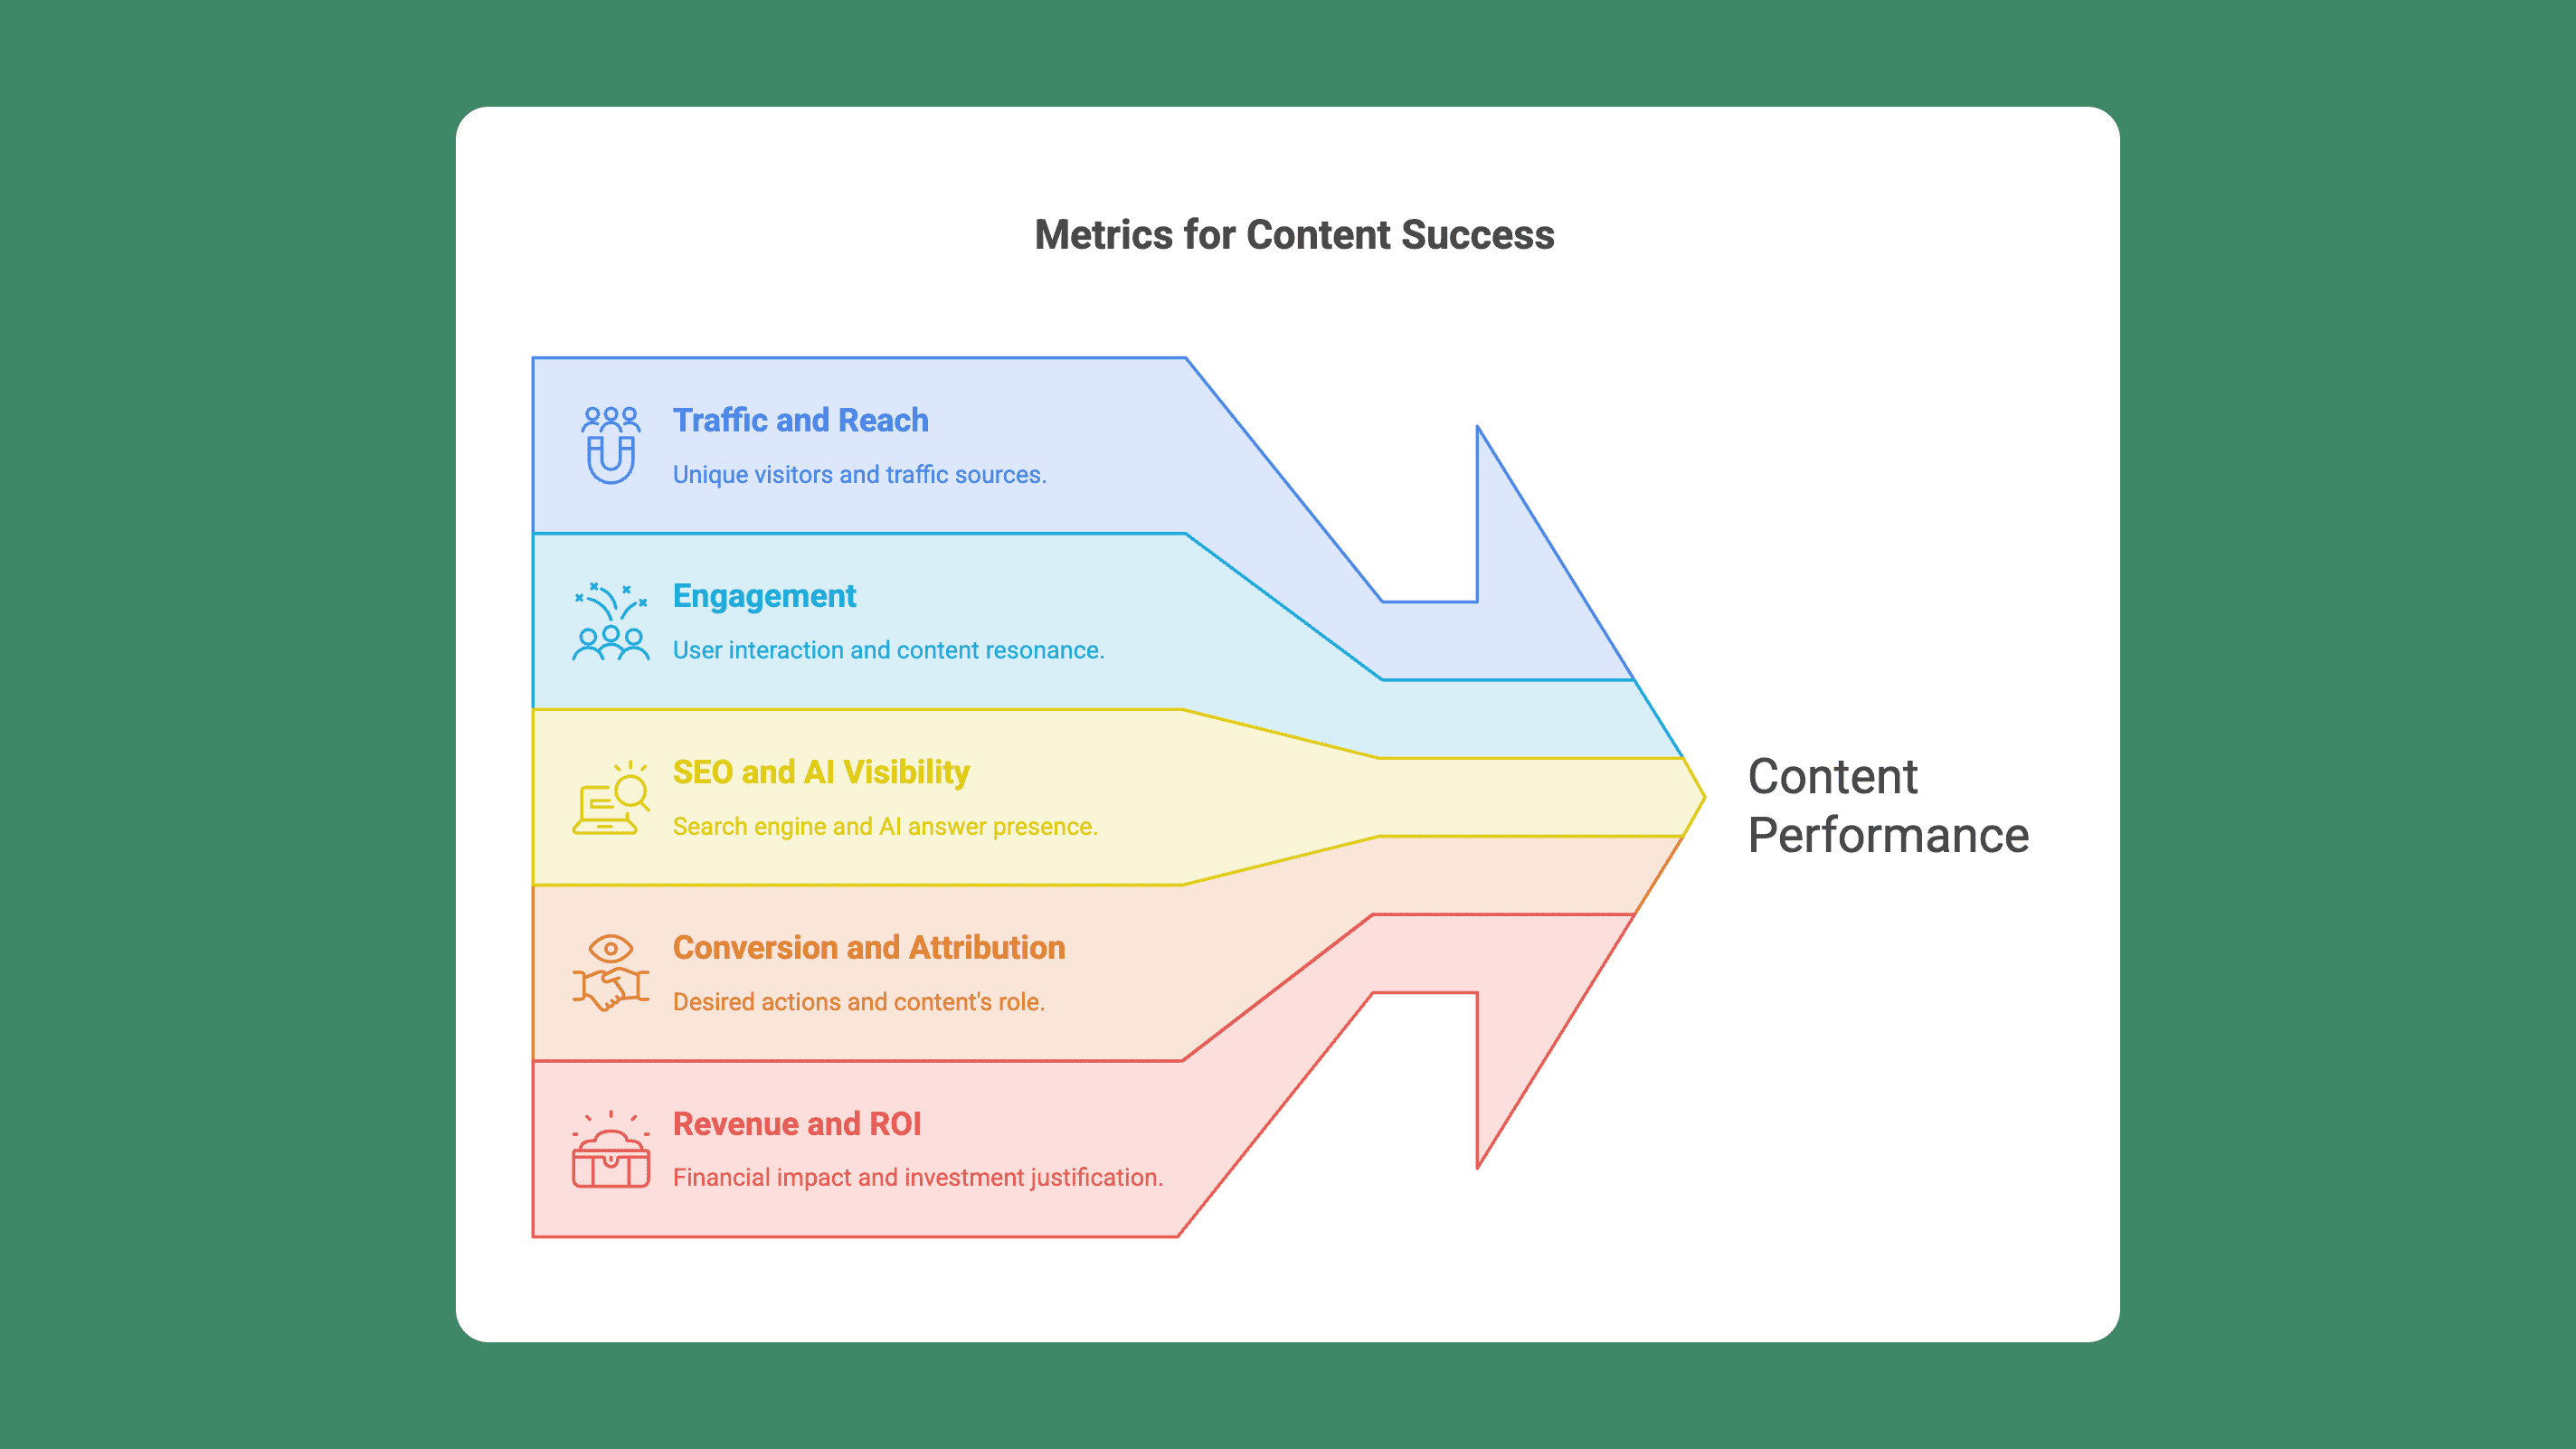
Traffic and reach metrics
Traffic metrics count how many people arrive and where they come from, and these content metrics include unique visitors, which count distinct individuals visiting your content.
Views (pageviews): total times a page loads. Good for spotting popular topics, weak as a standalone success measure.
New vs returning users: whether content pulls new visitors or the same ones.
Organic traffic: visitors from unpaid search, a proxy for how well content ranks.
Impressions: how often your pages appear in search results, from Google Search Console.
Traffic sources: which channels send readers (organic, social, email, referral, direct).
Read traffic as a starting point. High traffic with no downstream action usually means the topic attracts people who were never going to convert.
Comparing sources and visitor types also improves audience understanding, so you can see which traffic patterns bring the right people.
Engagement metrics
Engagement metrics show user behavior and what people do once they land.
Average engagement time: GA4 counts only time the page is in focus, so it is stricter than the old time-on-page.
Bounce rate: in GA4, the share of sessions that were not engaged. A session counts as engaged if it lasts longer than 10 seconds, fires a key event, or includes at least two page views.
Scroll depth: how far down the page readers get.
Events per session: how many tracked actions a visitor takes.
Social shares, comments, likes: social media engagement signals that help gauge off-site response.
These signals show how users interact, reveal user interest, and indicate whether content resonates.
One number in isolation misleads. A short average engagement time on a page built to answer fast is fine. Pair engagement with traffic before you judge a post.
SEO and AI visibility metrics
These metrics measure how findable your content is in search and, increasingly, in AI answers.
Keyword rankings: where your pages sit for target terms.
Backlinks: links from other sites, a signal of authority.
Clicks and click-through rate: from Search Console, how often an impression becomes a visit.
Brand mentions: how often your brand is named across the web.
AI visibility: whether your pages show up in AI Overviews, ChatGPT, or Gemini answers. Tools like Semrush now track this directly.
AI visibility is the newest addition. As more searches end inside an AI answer with no click, appearing in that answer becomes its own goal, separate from a ranking position.
Conversion and attribution metrics
Conversion metrics are key performance indicators that show whether content drives a desired action.
Conversion rate: share of visitors who complete the desired action, such as a signup, download, or purchase. A 5% conversion rate often signals effective content performance.
Leads: contacts captured through forms or gated content to generate leads at different stages of the buyer's journey.
Click-through on links and CTAs: whether readers act on the next step you offer.
Post-click events: what a visitor does after clicking a link, like completing a signup or purchase.
Cost per acquisition: what it costs to earn one conversion.
Here is where most measurement breaks. GA4 will tell you a conversion happened. It often will not tell you which post, email, or campaign earned it, especially when the visit came through social or an AI answer, and landing page performance often shapes attribution and conversion outcomes. Closing that gap gets its own section below.
Revenue and ROI metrics
Revenue metrics connect content to money and help justify content investment by showing what revenue the work actually generates.
Content ROI: return relative to production and distribution cost. Among core content marketing metrics, the common formula is (net profit / cost of investment) x 100, per Semrush.
Revenue per visit: average revenue generated per session.
Customer acquisition cost: total spend to acquire a customer through content.
Customer lifetime value: total revenue a customer produces over time.
These are the numbers an executive team responds to. They are also the hardest to produce, because they need content data joined to conversion and sales data, often with input from the sales team to prove revenue impact. That join is an attribution problem, which is where the next section goes.
Vanity metrics vs. metrics that prove impact
Not every metric deserves the same weight. Acrolinx splits them into two buckets, and the split is useful for content marketers and executives who need to separate directional metrics from decision metrics.
Directional metrics, sometimes called vanity metrics, include views, impressions, likes, and social shares. They show reach and relative popularity. Use them to spot which topics and formats attract people. They do not prove business results on their own.
Decision metrics include leads, conversion rate, cost per acquisition, and revenue. They tie content to outcomes. These are the numbers to bring to a budget conversation.
The mistake is reporting only directional metrics because they are bigger and easier to grow. A post with 50,000 views and zero signups is a traffic win and a business miss, and traffic without other metrics can give a distorted picture.
Pick metrics by goal, since the right metrics to track depend on business goals. A rough map:
Goal | Primary metric | Supporting metric |
|---|---|---|
Brand awareness | Organic traffic | Impressions, brand mentions |
Engagement | Average engagement time | Scroll depth, returning users |
Lead generation | Conversion rate | Leads, CTA click-through |
Sales | Revenue and content ROI | Cost per acquisition, post-click events |
Set one primary metric per goal. Everything else is context.
Content-to-conversion: the attribution metric everyone lists but few measure
Every guide lists conversion rate and ROI. Almost none explains how to attribute a conversion to the exact content that caused it. That is the hard part, and it is where reporting falls apart.
The reason is simple. When someone reads your post, clicks through, and signs up two days later from a different device, standard analytics struggles to connect those dots.
Traffic from social apps and AI answers often lands in GA4 as "referral" or "unassigned," so the content that did the work gets no credit. Fixing this takes three moves.
Tag every content placement
Give every link you publish for content creation a label so you can tell placements apart. UTM parameters do this: utm_source, utm_medium, and utm_campaign append to a URL and identify where a click came from.

Branded short links make those tagged URLs usable in public. With ShortPen, you add UTMs to a branded link, then read click analytics for your content efforts per link in real time: device, location, referrer, and timestamp.
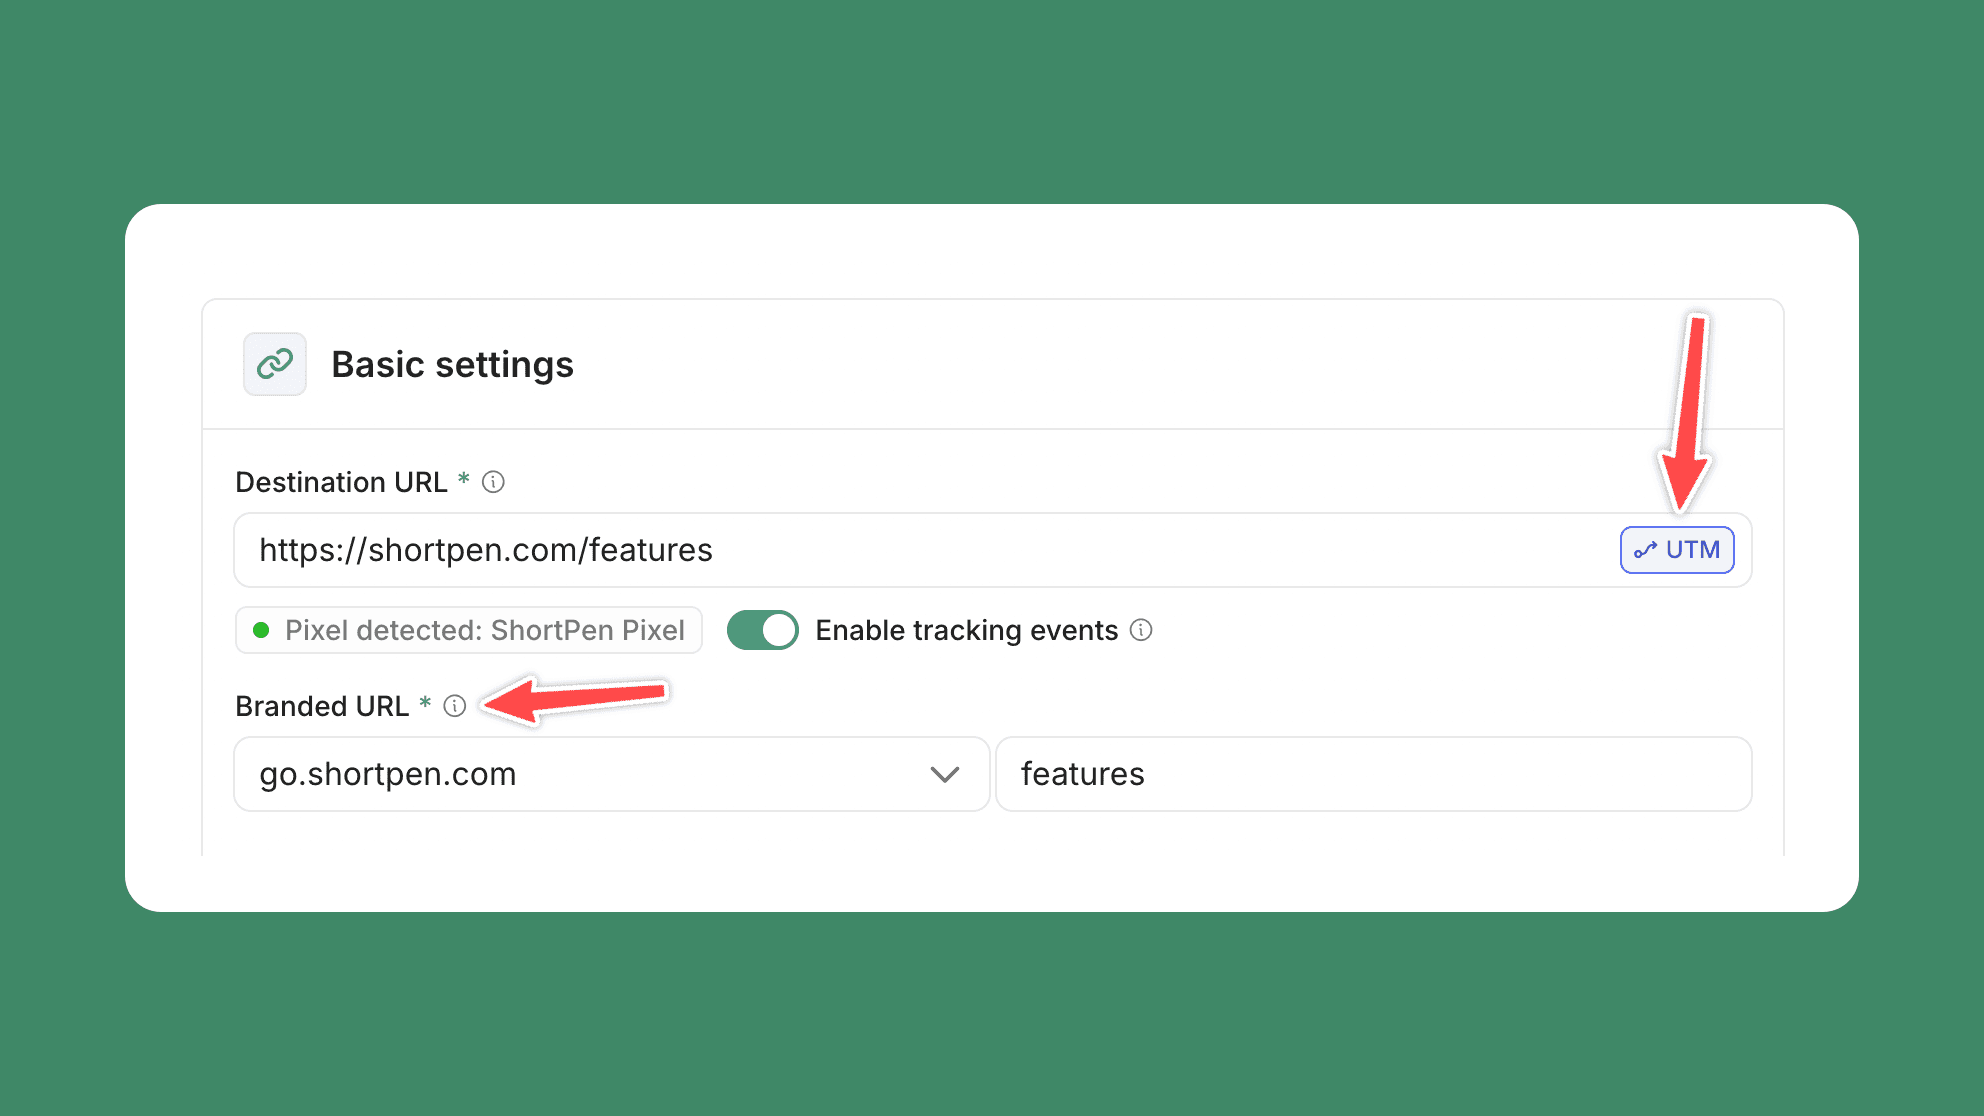
Clicks and QR scans are tracked automatically and separately, so a link in a newsletter and the same campaign on a printed flyer stay distinct in your reports, helping preserve performance data from all your efforts.
Track what happens after the click
A click is a start. Attribution needs the outcome that follows it, using conversion-focused key performance indicators to measure content marketing efforts.
Post-click event tracking closes the loop. With ShortPen, you install the ShortPen Pixel once (a snippet, or the Shopify app), then define events like a signup or a purchase on the destination web pages from the dashboard. Those events attribute back to the specific link that drove them.
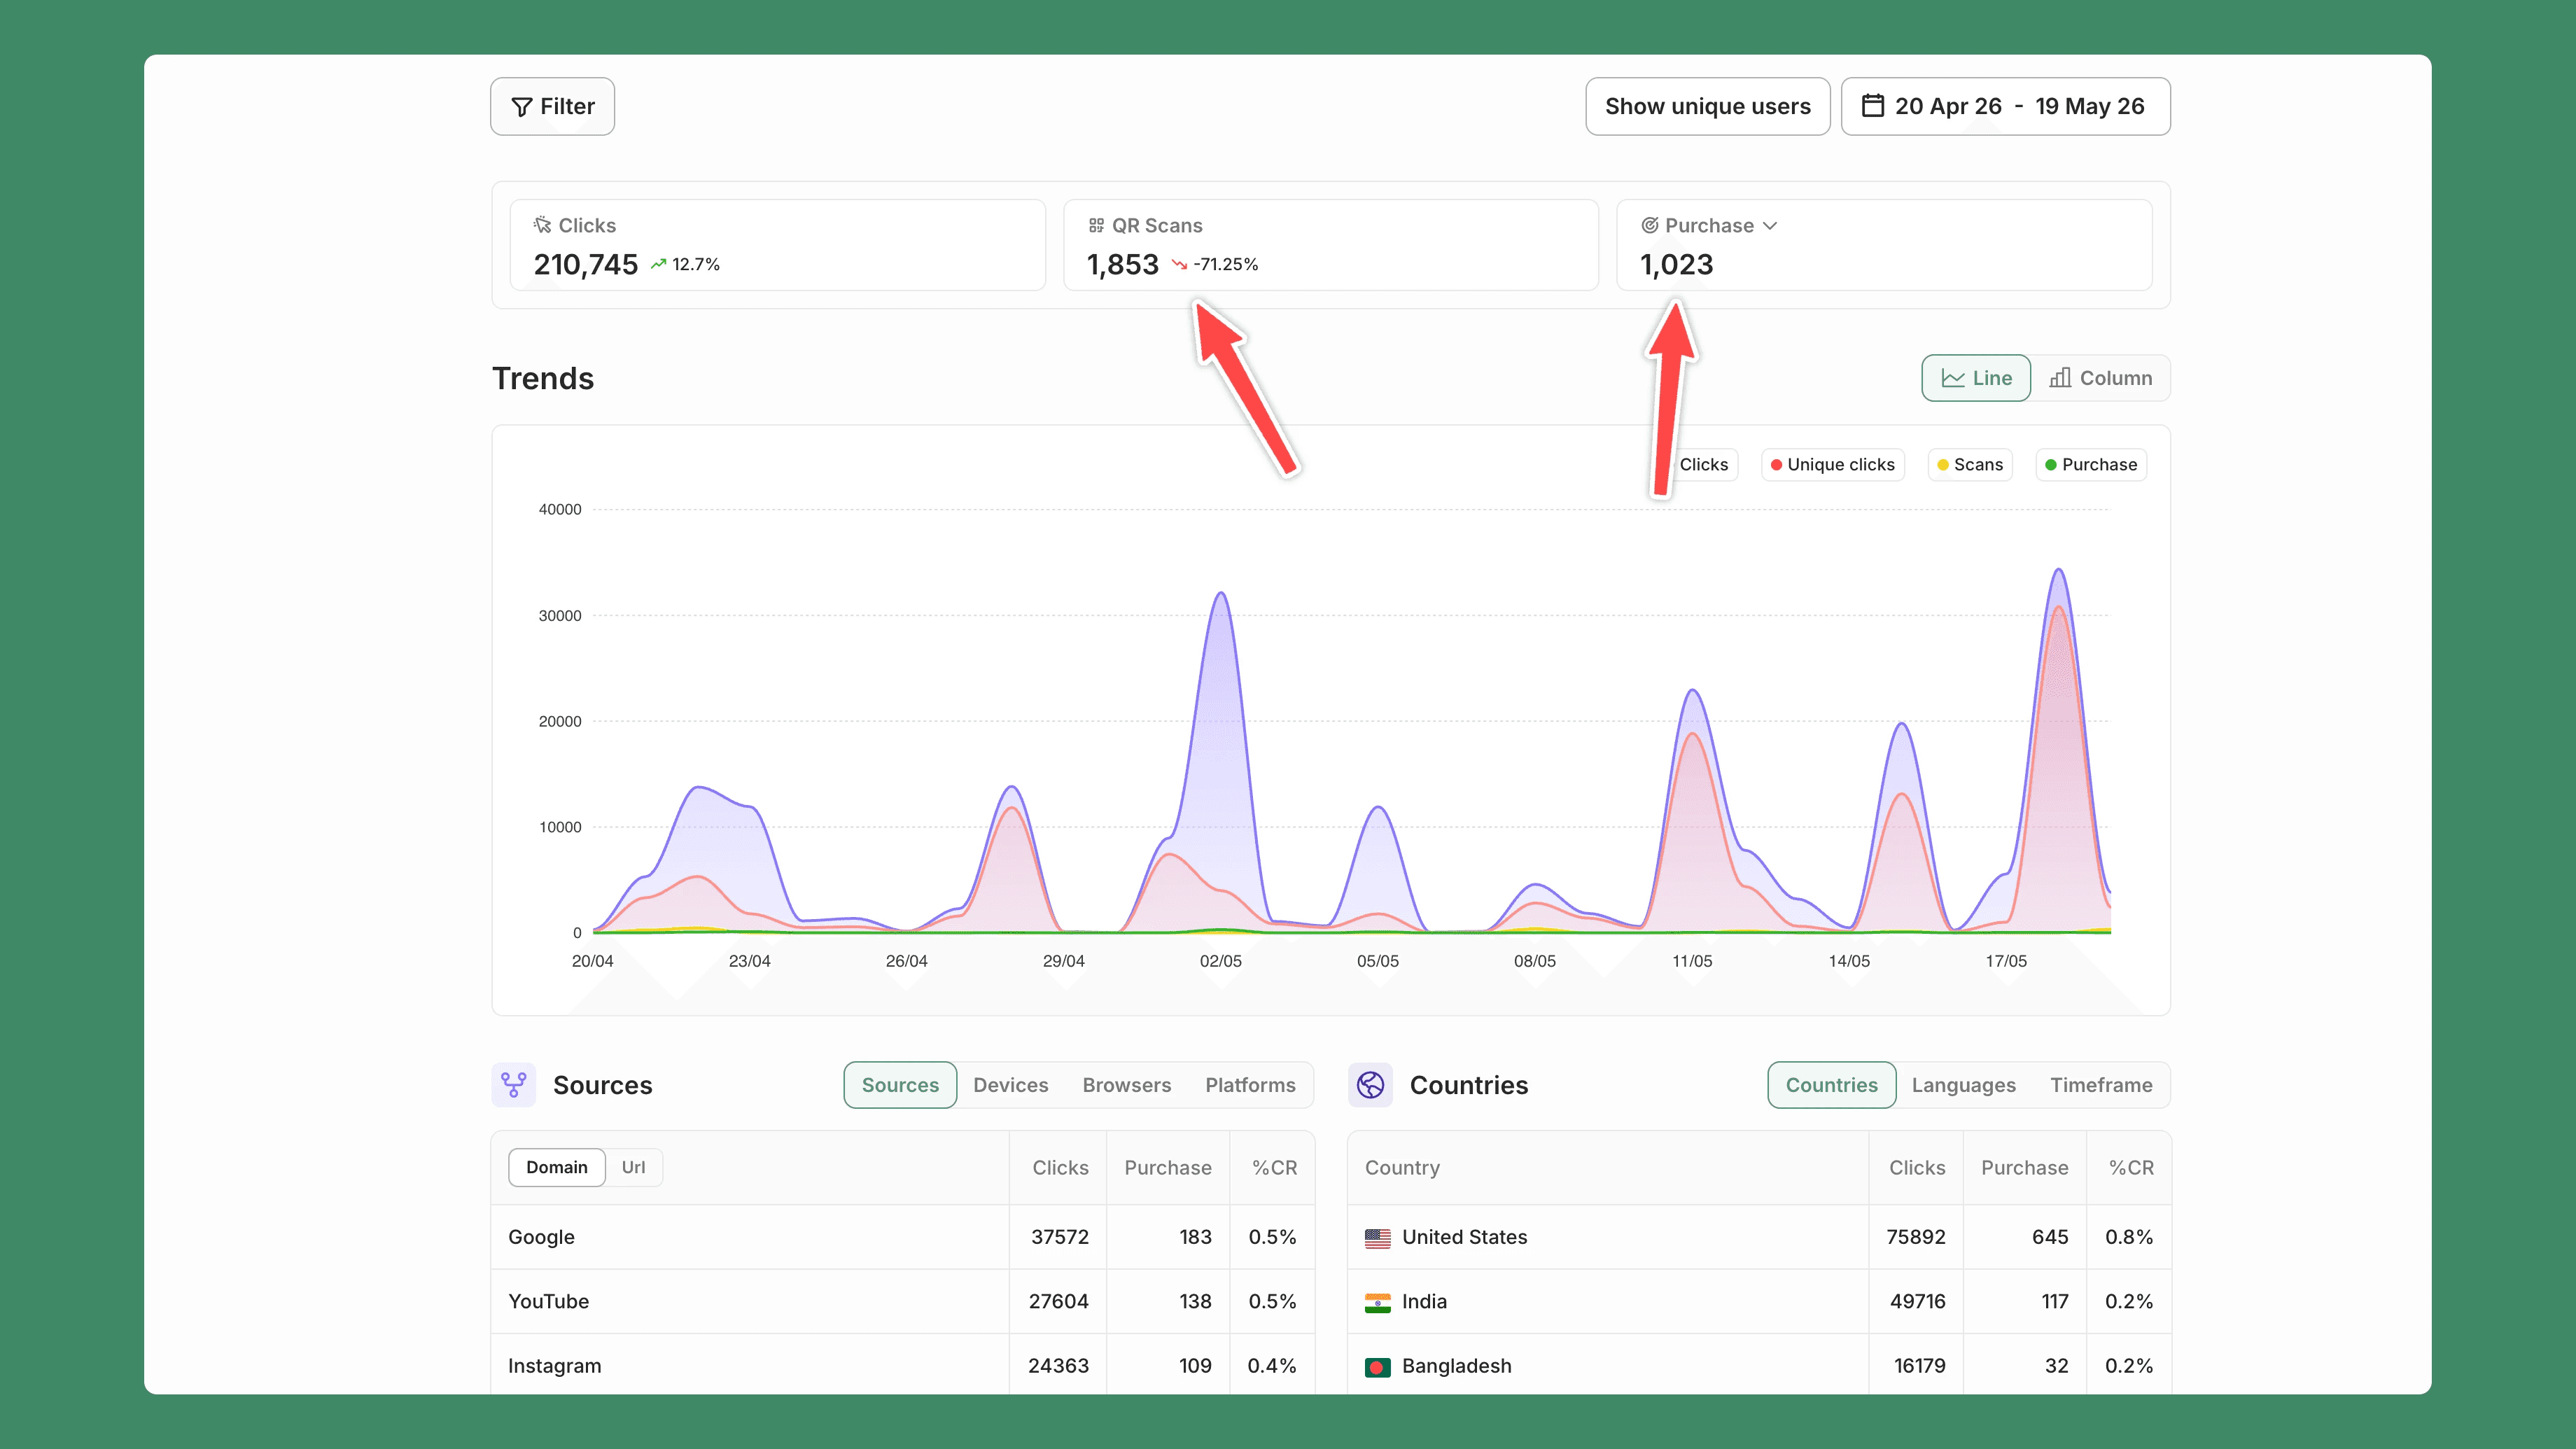
The Pixel supports URL-triggered events, code-triggered events, and integration-sourced events. On Shopify, it auto-maps ecommerce actions like product views, add-to-cart, and purchases, giving you performance data for data-driven decision making.
One note: events are not retroactive, so set them up before a campaign, not after.
Measure content that lives off your site
Most content does not sit on your domain. It lives in social bios, email, video descriptions, and on printed material. GA4 sees these weakly.
Any ShortPen link can become a dynamic QR code, and scans report separately from clicks, so a QR on packaging or a conference banner is as measurable as a link in a blog post. Because the code is dynamic, you can change its destination after printing without reprinting.
Workspaces and folders keep this organized. Separate clients, brands, or campaigns into their own space, then read analytics at link or workspace level. You can test all of this on ShortPen's free plan, which includes unlimited links, QR codes, and clicks, plus one custom domain.
How to measure content performance in five steps
Metrics only help if you have a process to act on them. Here is a five-step loop.
Set a goal per piece or campaign. Awareness, engagement, leads, or sales. Write it down before publishing.
Pick three to five metrics. One primary metric tied to the goal, a few supporting ones. Resist tracking everything.
Choose your tools. Match tools to the metrics you picked rather than buying a suite you will not use.
Tag and track. Add UTMs, use branded links, and set up post-click events so attribution works from day one.
Review on a cadence and act. Weekly for active campaigns, monthly for evergreen content. Update or cut underperformers, repeat what works.
A workable tool stack:
GA4 for engagement and on-site conversions.
Google Search Console for impressions, clicks, and queries.
Semrush or Ahrefs for rankings, backlinks, and AI visibility.
HubSpot or your CRM for leads and pipeline.
A link layer like ShortPen for per-link attribution, QR tracking, and post-click events, with an API and analytics endpoint to pull the data into your own BI stack.
Most of these have free tiers, so you can assemble a full stack before paying for anything.
ShortPen's API access sits on paid plans, with a 14-day premium trial if you want to test it.
How AI search is changing content performance measurement today
Search behavior shifted, and measurement has to follow.
Zero-click answers are rising. AI Overviews and chat assistants answer inside the results page, so a ranking can earn an impression and no visit. Semrush reported that Wikipedia saw roughly an 8% drop in human pageviews compared with 2024, which it attributed largely to AI search and social video.
Organic traffic alone is no longer enough, so treat pure organic clicks as one signal among several, not the whole scorecard.
AI visibility is its own metric now. Being named in an AI Overview, ChatGPT, or Gemini answer is a form of reach that does not show up as a session. Track it separately for new pages and existing content, since older URLs may still be cited by AI systems.
LLM referral traffic is messy. Visits from AI tools often land in GA4 as "referral" or "unassigned," which changes how content performance measures are interpreted. You can isolate them with custom channel groups, and a tagged branded link keeps the click attributable no matter where the AI surfaced it.
On privacy, the ground settled in a direction worth knowing. Google reversed its plan to remove third-party cookies (announced July 2024), and in October 2025 it retired the Privacy Sandbox APIs that were meant to replace them.
Third-party cookies stay in Chrome, but Safari and Firefox still block them and many users reject them.
First-party and link-level measurement, the kind you own, is the reliable base to build on.
FAQ
Which content performance metrics should I start with?
Start with one metric per goal. The right mix depends on your target audience and business goals. For most blogs that means organic traffic for reach, average engagement time for attention, and conversion rate for outcome. Add more once those three are stable.
What is the difference between vanity metrics and performance metrics?
Vanity metrics like views and likes show reach and popularity. Performance metrics like leads, conversion rate, and revenue show business results. Use vanity metrics to spot patterns and performance metrics to make decisions.
What tools do I need to measure content performance?
At minimum, analytics tools like Google Analytics and GA4 for on-site behavior and Google Search Console for search data. Add Semrush or Ahrefs for rankings and backlinks, a CRM like HubSpot for leads, and a link-management tool like ShortPen for per-link attribution and post-click events.
How do I connect a blog post or campaign to an actual signup or sale?
Tag the links in that content with UTMs, publish them as trackable branded links, and set up post-click event tracking. With ShortPen, the ShortPen Pixel attributes a signup or purchase back to the exact link that drove it.
How do I track content shared off my website, like social posts or printed QR codes?
Use branded links for digital placements and dynamic QR codes for print. ShortPen tracks clicks and scans separately, so each placement reports on its own, and dynamic QR codes can be redirected after printing.
How often should I review content performance?
Weekly for active campaigns and monthly for evergreen content. Often enough to catch problems, spaced enough to gather meaningful data.
How is AI search changing content measurement?
More searches end without a click, so AI visibility and brand mentions matter alongside traffic. LLM referral traffic is hard to attribute in GA4, which makes tagged links and first-party tracking more useful.
Conclusion
The metrics that matter are the ones tied to a goal you set before publishing. Track reach and engagement to learn what attracts and holds your audience, then track conversions and revenue to prove the work paid off. The piece most guides skip, attribution, is what turns a content report into a business case.
Start small. Pick your highest-traffic post, tag its links, and set up one post-click event so you can see exactly what it produces. Once that loop works on one piece, extend it across the rest.
Ready to make every click count?
Simplify your link management, gain valuable insights, and take control of your online presence. Your journey to better links starts here.