The Essential Guide to Influencer Marketing Measurement and Metrics
Last updated:
ShortPen University


LucaG is the co-founder of ShortPen. Before that, he built Guadagnissimo from scratch, a personal finance blog that reached hundreds of thousands of readers per year and was later acquired. That experience is where he learned SEO and marketing attribution hands-on. He also runs NTSOT, a newsletter on tools for work and life. His background spans product design, growth, and building online businesses.
Show more
Influencer marketing has evolved from focusing on vanity metrics (likes, follows, comments) to tying campaigns to real business results.
Today’s marketers demand clear data on clicks, conversions, and sales. In fact, 80% of brands are holding steady or increasing their influencer budgets, and 47% are upping spend by 11% or more, thanks to a shift toward ROI-focused measurement.
In this guide, we’ll break down how to set goals, pick the right KPIs, and use tools to quantify your influencer marketing success.
Influencer Marketing Measurement: What are the Most Important Metrics to Track for Businesses?
Influencer marketing relies on a mix of awareness, engagement, and conversion metrics. Key indicators include:
Reach & Impressions: How many people saw an influencer’s content? Reach is the unique audience count. Impressions are total views (one person may see a post multiple times). These gauge brand exposure and campaign breadth.
Engagement: Likes, comments, shares, saves, and other interactions on the influencer’s posts. High engagement shows the content resonates. Engagement rate (total interactions divided by followers) is often tracked to compare effectiveness.
Audience Growth: Increase in your brand’s followers or subscribers during/after a campaign. A rising follower count on your channels suggests the influencer drew new fans to your brand.
Web Traffic & Clicks: Visits to your site or landing page originating from the influencer’s content. Use link analytics and UTM tags to track clicks and referral traffic directly from influencer posts.
Conversions: The number of desired actions (sales, sign-ups, downloads) driven by the campaign. This is the most concrete metric of success. Track conversions via unique promo codes or link tracking pixels.
Conversion Rate & Cost Metrics: How efficiently clicks turn into conversions. Important examples include conversion rate (conversions ÷ clicks) and Cost Per Acquisition (CPA), how much you spend on the campaign per new customer. These directly tie an influencer’s cost to business outcomes.
Engagement Value (Earned Media Value): Estimation of the dollar value of the influencer’s reach and engagement compared to paid ads (covered later).
Share of Voice & Brand Mentions: Percentage of total social/media conversations about your industry that mention your brand. Tracking brand mentions (even without tags) shows organic buzz generated by influencers. Share of voice compares your campaign’s visibility against competitors.
Choosing the right mix of these metrics depends on your campaign goals (brand awareness vs. direct sales). Always align your KPIs with what you want to achieve – e.g., reach and impressions for awareness, engagement, and audience growth for consideration, conversions, and revenue for bottom-of-funnel impact.
Setting Influencer Marketing Goals
Clear, specific goals are the first step to measurement. Think of influencer campaigns in funnel terms. Most goals fall into three pillars:
Awareness: Top-of-funnel campaigns aim to expose your brand to new audiences. Metrics: reach, impressions, share of voice.
Consideration/Engagement: Mid-funnel goals focus on generating interest. Metrics: post engagement (likes, comments, shares), user-generated content, time on page, or click-throughs. This shows people are paying attention and engaging.
Conversion: Bottom-of-funnel goals drive a concrete action (purchase, sign-up, download). Metrics: website conversions, sales revenue, leads generated, conversion rate, and ROI.
Setting a goal turns a vague wish (“get more exposure”) into a target, such as “increase unique reach by 25%” or “earn 200 new email sign-ups.”
This clarity ensures you track the right KPIs from the start.
For example, if the goal is awareness, you might measure total reach and the number of new followers gained. If it’s conversions, you’d focus on sales volume, conversion rate, and cost per sale. Define your benchmark metrics before launching the campaign so “success” is clear in advance.
Measuring Influencer Marketing Performance
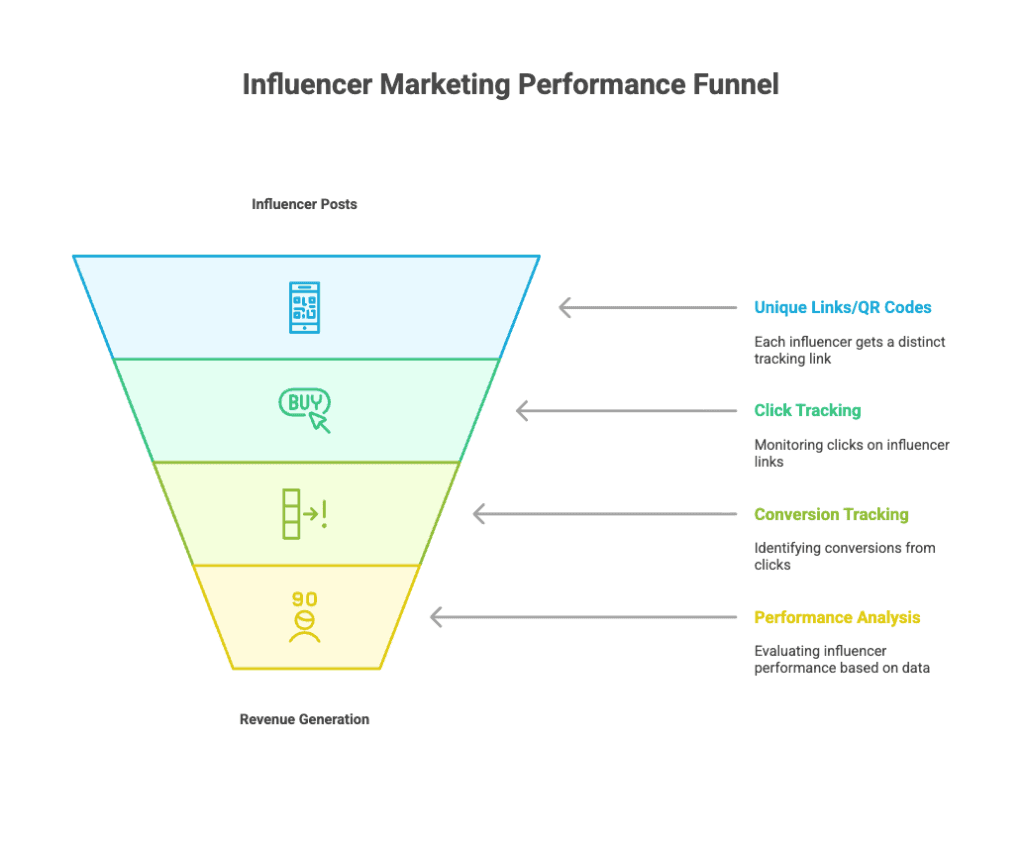
To measure performance, you need precise tracking from influencer post to action.
Instead of giving all influencers a generic link (where you’d only see a traffic spike), use unique trackable links or QR codes for each influencer and even for different posts.
Tools like ShortPen let you create a branded link or QR code for each influencer or content piece.
For instance, you might use go.yourbrand.com/chloe for Influencer Chloe’s Instagram Reel, go.yourbrand.com/ben for Ben’s TikTok link, or learn more about custom short links for your brand.
This way, every click and conversion is tied back to the right creator.
In practice, a ShortPen-style link manager also lets you append UTM parameters or custom fields (source, campaign, content type) to each link.
Those tags get ingested by Google Analytics (or your BI tools) so you know exactly which influencer or post led to visits, sign-ups, or sales.
You can also generate unique promo codes or affiliate links per influencer. When a customer uses that code at checkout, it’s proof that the influencer drove the sale.
Once a campaign is live, log into your analytics dashboard and look at performance per influencer.
For example, data might show that Chloe’s link got 5,000 clicks but only 50 sales, while Ben’s link saw 1,200 clicks and 150 sales.
Although Chloe’s reach was higher, Ben’s smaller but highly engaged audience converted far better. This insight comes only from detailed tracking: you’d otherwise have overvalued Chloe based on vanity numbers.
By comparing each influencer’s click-through and conversion numbers, you identify which partnerships actually generate revenue.
Tools like ShortPen make this simple: every link’s analytics are visible so you can see clicks, conversion rates, revenue, and ROI by influencer in one place.
Calculating ROI
At the end of the day, every marketer needs ROI.
The basic formula is straightforward: ROI = (Revenue – Cost) / Cost (often expressed as a percentage).
For example, if your influencer campaign generated $20,000 in revenue on a $5,000 spend, ROI = (20,000–5,000)/5,000 = 3 (300%).
This single number tells stakeholders if the campaign was a financial win.
The challenge is nailing down what goes into “revenue” and “cost.”
For revenue, use your tracked link data: ShortPen or Google Analytics can sum all sales (or sign-ups) that came through those links or promo codes.
For cost, account for every expense tied to the campaign: influencer fees, free product seeding, agency/platform fees, production costs, and even the salary/time of your team managing the campaign.
Only by accounting for all costs do you get a true ROI.
Real-world ROI for influencer marketing is often high: studies suggest businesses earn on average about $5.78 for every $1 spent on influencers.
To prove ROI, collect your actual sales data from link analytics, subtract the total campaign cost, and apply the formula.
Evaluating Campaign Performance
After a campaign, review all metrics relative to your goals.
A comprehensive campaign report should include: influencer details (posts, reach, engagement), content performance (views, clicks, conversions per post), audience data (demographics of those reached), and financial outcomes (cost, revenue, ROI).
For example, if your goal was awareness, compare reach/impressions across influencers. If it was engagement, compare likes/comments, and if it was sales, compare conversions and ROAS.
Use this data to spot top performers. Who drove the most conversions per dollar? Which content format (video vs. story vs. blog) did best? Which platforms worked?
Ideally, you’ll see a pattern, perhaps a particular influencer consistently yields high ROI, or a specific message resonates. These lessons guide your next campaign.
Also compare to past campaigns: set benchmarks (e.g. target engagement or conversion lift) and see if you hit them.
The richer your tracking (thanks to UTMs, ShortPen, pixels, etc.), the more insight your report yields.
Understanding Success Metrics
Not all “wins” look the same. Success metrics depend on your goal: maybe a successful awareness campaign doesn’t drive immediate sales but spikes traffic and brand searches. If conversions were the goal, the conversion rate and revenue are key.
Always tie your metrics back to business impact.
For example, a high engagement rate is valuable only if it eventually drives leads or sales. Consider both quantitative data (sales, traffic, engagement rates) and qualitative signals (sentiment, brand sentiment).
Many marketers include brand lift surveys or social listening (tracking brand mentions and sentiment) to complement the numbers.
In short, success means meeting the KPI you defined at the start, whether that’s “50 new leads” or “500,000 impressions” or “10% increase in website traffic.”
Measuring Influencer Impact
Beyond direct KPIs, evaluate the broader impact of the influencer partnership.
Look for long-term effects: Did the influencer collaboration lead to an uptick in brand searches or organic traffic? Has your brand’s share of conversation grown? Are there valuable user-generated posts from happy customers?
Influencers can also affect softer metrics: a credible influencer endorsement may improve brand trust or sentiment.
Some brands use surveys or NPS to gauge if customer perception improved post-campaign.
While harder to quantify, these signs of influence (community building, buzz, brand affinity) complement the hard data.
Over time, building a roster of high-impact influencers can turn into a sustainable acquisition channel, not just one-off spikes.
Understanding Influencer Rates
It’s also important to understand how much influencers cost, since ROI depends on balancing performance against price.
Influencer pricing varies widely by platform and follower count. For example, industry benchmarks suggest Instagram influencers typically charge (source):
Nano (1K–10K followers) – around $10–$100 per post
Micro (10K–100K) – $100–$500
Mid-tier (100K–500K) – $500–$5,000
Macro (500K–1M) – $5,000–$10,000
Mega (1M+) – $10,000+
Similar scales exist for TikTok and YouTube, though formats and engagement can change pricing.
Always negotiate terms (one-off post vs. bundle, cross-platform posting, exclusivity rights).
The key is to evaluate each influencer’s cost per result.
A micro-influencer charging $200 who drives 20 sales at $50 profit each yields $1000 profit, excellent ROI. A mega-influencer charging $10,000 for scant conversions is not.
By tracking conversions per influencer, you can compute cost per acquisition and ROAS for each influencer partnership.
Tracking Engagement and Conversion Rates
Engagement rate = (likes+comments+shares)/followers.
Conversion rate = (conversions)/(link clicks).
These show how well an audience is responding. Always tie them to specific posts via tracking.
For example, ShortPen’s analytics can show that Chloe’s Instagram Story had a 12% swipe-up conversion rate, while Ben’s TikTok link had a 15% tap-through rate.
To track conversions, use pixels or webhook callbacks: ShortPen’s tracking pixel can fire on your thank-you page so you know exactly which link (influencer) generated the sign-up or sale.
Likewise, UTMs on influencer links feed into Google Analytics funnels.
Set up a funnel or goal in analytics to capture form submissions, purchases or other actions.
That way, you can say “X% of people who clicked this influencer’s link actually checked out,” and compare conversion rates across influencers. High conversion rate + high engagement rate usually signals a great fit.
Evaluating Influencer Content
Not all influencer content is created equal. Quality and relevance affect performance.
After campaigns, review which types of posts performed best.
Was it a how-to tutorial, a personal story, or a quick product demo? Did video outperform static images?
You might find that short-form video got more views but images generated more clicks. Use link tracking and analytics to tie specific content pieces to outcomes.
For example, if you provided multiple creatives (e.g. two different product shots), check which one’s link had a higher click-through. Give feedback to influencers on what content led to results.
Over time, refine your brief: if influencer-generated unboxing videos convert better than selfies, lean into that format.
Tools like ShortPen let you even label links by content type (e.g. UTM &utm_content=video_post) so you can compare content categories in analytics.
Measuring Audience Growth
A successful influencer partnership often leaves a brand with new followers or newsletter subscribers.
Track how many new followers you gained on social channels during the campaign, using analytics or tools.
For example, if you ran a month-long influencer campaign on Instagram, compare your follower count at the start and end.
Also track email or text subscribers if influencers share your sign-up link.
Audience growth is a vanity metric unless you tie it to future revenue (e.g. higher newsletter sign-ups leading to sales).
Still, a growing community means more people you can remarket to later, so it’s a sign of future opportunity. If growth stalls, re-evaluate whether the influencers’ audiences align with your brand.
Using Earned Media Value
Earned Media Value (EMV) attempts to quantify an influencer’s impact in dollars. It estimates what you’d have had to spend on advertising to get the same reach/engagement.
In practice, EMV takes impressions, likes, etc., and applies ad-market CPM/CPC benchmarks. For example, one formula is:
EMV = (Total Impressions/1000)×CPM + (1500×Cost per Like) + (500×Cost per Comment).
This might show that an influencer’s 10,000 likes and 2 million impressions are “worth” $X.
EMV doesn’t equal campaign ROI, but it gives a sense of value relative to paid media.
Use EMV as a complementary metric: it can highlight which influencers deliver the most eyeballs per dollar. Many platforms (including analytics suites) compute EMV automatically.
In your reports, include EMV to bolster the case for influencer ROI, but always pair it with actual sales and ROI figures for the full picture.
Measuring Return on Ad Spend (ROAS)
ROAS is another profitability metric: ROAS = Revenue / Ad Spend.
In influencer terms, think of each paid post as an “ad.” If you spent $1,000 on a series of sponsored posts and those links drove $4,000 in sales, your ROAS is 4:1 (400%).
This is similar to ROI but expressed as a multiple.
To measure ROAS, again, use your tracked links to sum revenue. Then divide by total influencer spend.
A ROAS above 1:1 means profit.
It’s often easier to communicate (“We got $5 back for every $1 spent”) and is widely used in e-commerce.
Like ROI, good ROAS benchmarks depend on your industry (some see $5–$6 per $1 spent).
Always compare influencer ROAS to your performance on other channels. If Google Ads normally gives a 2:1 but your influencer campaign delivered a 6:1, that’s a strong signal to allocate more budget to influencers.
FAQ
What metrics should I start with?
Focus on metrics tied to your goals. For awareness, track reach, impressions, and share of voice. For engagement, monitor likes/comments and engagement rate. For conversions, track clicks, conversion rate, and sales revenue. Start with clear objectives so you know which numbers matter.
How do I track influencer campaign traffic?
Use unique links or UTMs. Give each influencer a branded short URL or QR code that includes UTM tags (for source, medium, campaign). Platforms like ShortPen let you create and track these links easily. Google Analytics or similar tools will then show exactly how much traffic and how many conversions came from each influencer link.
What is earned media value (EMV)?
EMV is an estimate of how much your influencer’s performance would cost if you had to pay for equivalent reach and engagement. It converts impressions, likes, comments into a dollar figure based on ad benchmarks. While not a substitute for actual ROI, it helps quantify an influencer’s content value.
How do I calculate influencer ROI?
Use (Revenue – Cost) / Cost. Collect all sales tracked from influencer links as revenue, and tally all campaign costs (fees, products, labor). Plug them into the formula and multiply by 100 for a percentage. An ROI above 100% means you made more than you spent.
How do I evaluate if an influencer’s rate is worth it?
Compare their cost to the results they drive. Calculate cost per acquisition or ROAS for each influencer. If an influencer charges $500 but delivers $3,000 profit in sales, that’s a 600% return – generally a great deal. If another charges more but yields less profit, rethink that partnership. Data is your guide. Use link analytics to attribute sales to each influencer and judge rates accordingly.
Conclusion
Effective influencer marketing is no longer a guess-and-check game.
By setting clear goals, choosing the right KPIs, and using precise tracking (UTM-tagged links, conversion pixels, unique promo codes), marketers can treat influencer campaigns as reliable growth channels rather than marketing experiments.
Tools like ShortPen simplify this process: you can generate branded short links or QR codes for each influencer, append custom UTM parameters, and automatically collect click and conversion data in a single dashboard.
Armed with data on engagement, traffic, conversions, and cost, you can calculate true ROI and double down on top-performing influencers.
This data-driven approach justifies your budget, optimizes future campaigns, and ultimately transforms influencer marketing into a predictable, revenue-driving strategy.
Ready to make every click count?
Simplify your link management, gain valuable insights, and take control of your online presence. Your journey to better links starts here.